Effica.cy is a proposed cloud-based GIS tool that would allow organizations to perform complex cost/benefit evaluations right in an internet browser
The Washington Post recently reported that the Trump administration is planning on cutting $6 billion from the HUD budget, while others have reported that these cuts would eliminate the Community Development Block Grant (CDBG) program in its entirety.
CDBG is arguably the most flexible program the feds have for making placed-based housing and community economic development investments in American cities. This is a key reason why CDBG continues to garner bipartisan support in Congress.
In his confirmation hearing, HUD Secretary Ben Carson remarked, “(CDBG) is very important because it gives people a great deal of flexibility. I’d be looking to increase the flexibility, but at the same time, have much better control of the finances.”
This is a totally reasonable statement, and (should the CDBG program remain) the best way to have better control is to understand what works and what doesn’t.
In a 2014 special issue of Housing Policy Debate, renowned housing policy expert Raphael Bostic, a former HUD Assistant Secretary remarked,
“For a program with the longevity of the CDBG, remarkably few evaluations have been conducted, so relatively little is known about what works…Evidence on effective ways to use CDBG funds to reduce segregation while also promoting community development would help more communities pursue policies that lie at the intersection of these important goals. Studies examining whether collaborative uses of program resources promoted innovative local solutions, and if so, how, would provide communities with a road map for pursuing similar approaches. Yet, this literature remains largely incomplete. A meta-analysis of CDBG impacts is not currently possible.”
In an article from the same journal issue, scholars William Rohe and George Galster further elaborated,”…it is very difficult to attribute any general improvements in the area to the CDBG expenditures in view of the lack of persuasive counterfactuals and ability to control for other activities in the area.”
Maybe if we knew more about the efficacy of these investments, we could better defend their budgetary existence.
We believe that combining the power of econometrics, open data and web-based GIS can help provide HUD and other agencies with counterfactuals and ultimately, an inexpensive solution for evaluating placed-based investments.
The what…
Imagine an economic development agency develops 120 new units of affordable housing across a handful of blocks in Philadelphia. The direct benefits of these investments are safe, new housing, but the indirect benefits might include new private real estate activity or a reduction in nearby crime.
In order to estimate these indirect benefits, the agency has to compare outcomes for blocks that received the new housing (the treatment group) to a control group – a set of blocks that are comparable in every way to those that received the housing development, but did not receive the treatment.
One way to achieve this comparison is to hire a quantitative PhD (like those at Urban Spatial) to develop an econometric research design – a time consuming and expensive endeavor for many cities.
An alternative solution is to match treated blocks to a subset of control blocks by using a host of demographic, land use and amenity-based factors available in open data sets. Once this match is made, an unbiased comparison of outcomes before and after the investment can be made.
The ‘Propensity Score‘ algorithm is a common econometric technique for performing this type of matching. Its usefulness is rooted in the fact that it is an algorithm – a programmable set of rules that helps the researcher balance control and treatment groups to estimate ‘treatment effects’. The algorithm can then be reused repeatedly by individuals seeking to measure outcomes of any place-based treatment – no PhD is needed.
Imagine hard-wiring the Propensity Score algorithm into a cloud-based mapping application that would provide organizations with a cost-effective, subscription-based solution to conducting evaluations of their critical place-based investments.
We call it Effica.cy – a cloud-based SaaS GIS tool for evaluating interventions in place. Effica.cy would use city open data to match blocks that receive investments to comparable blocks that do not and calculates differences in outcomes. Here’s how it would work:
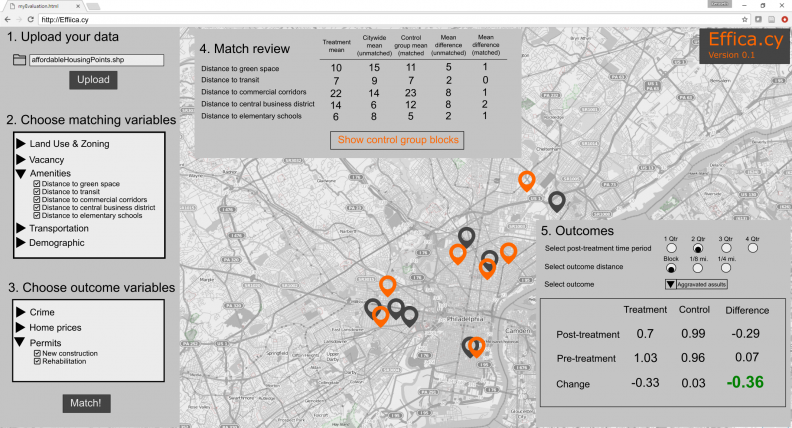
Referencing the numbers in the image above, (1) a user uploads a dataset (shapefile) of placed-based investments (perhaps affordable housing developments). In the image above, the developments appear as grey points on the map.
(2) The user chooses a series of open data metrics including demographics and amenity access that can be used to perform the matching.
(3) The user chooses a set of outcomes that they believe are important to their institutional goals.
(4) Once matching has been completed, the user can analyze a set of metrics to see how comparable the control group is. Using distance to green space as an example, the ‘treatment mean’ refers to the mean distance to green space for blocks that received the housing developments – the treatment group. ‘Citywide mean (unmatched)’ refers to the average distance to green space for every block Citywide. It is clear that these means are not comparable.
However, once matched, the ‘Control group mean (matched)’ metric tells us that matching has yielded a set of control group blocks that are in fact, comparable – at least with respect to distance to green space. Now we can view the matches on the map – displayed here in orange.
(5) The last step is to understand if the affordable housing interventions had any indirect benefit on outcomes like crime or the number of building permits pulled. To do so, the user first specifies the number of quarters after the treatment for which comparisons are to be made. She also selects the spatial extent of the outcomes and the specific outcome of interest.
As we have an appropriately matched control group and a definition of pre and post time periods, we can look at a simple table of differences across time and space. Here for instance, the average difference in assaults for the treatment group between the pre and post time period is -0.33 but it is only 0.03 for the control group. Thus, blocks that experienced the new housing developments saw greater decreases in crime than the control group blocks.
Finally, by comparing differences over time and differences between control and treatment groups, we arrive at what econometricians refer to as the ‘difference-in-difference’. In this case it is -0.36. Such a result would suggest that the affordable housing on these blocks led to a drop in crime. We could then ask if these differences were statistically significant.
This tool is important because it allows agencies to perform much higher quality evaluations then what simple performance metrics have to offer. No doubt, a PhD econometrician could develop a more robust research design, but a SaaS license for a product like Effica.cy would be exponentially less expensive.
HUD isn’t the only the organization that could benefit from Effica.cy. Any entity making placed-based investments could use this tool to calculate costs and benefits and develop a data-driven advocacy narrative.
Ken Steif, PhD is the founder of Urban Spatial. He is also the director of the Master of Urban Spatial Analytics program at the University of Pennsylvania. You can follow him on Twitter @KenSteif.