Below is an executive summary. The full report and methodology can be accessed here. The full codebase can be accessed on GitHub here. This work was co-authored by Matt Harris & Sydney Goldstein and developed in collaboration with Dr. Dyann Daley and Predict Align Prevent.
Motivation
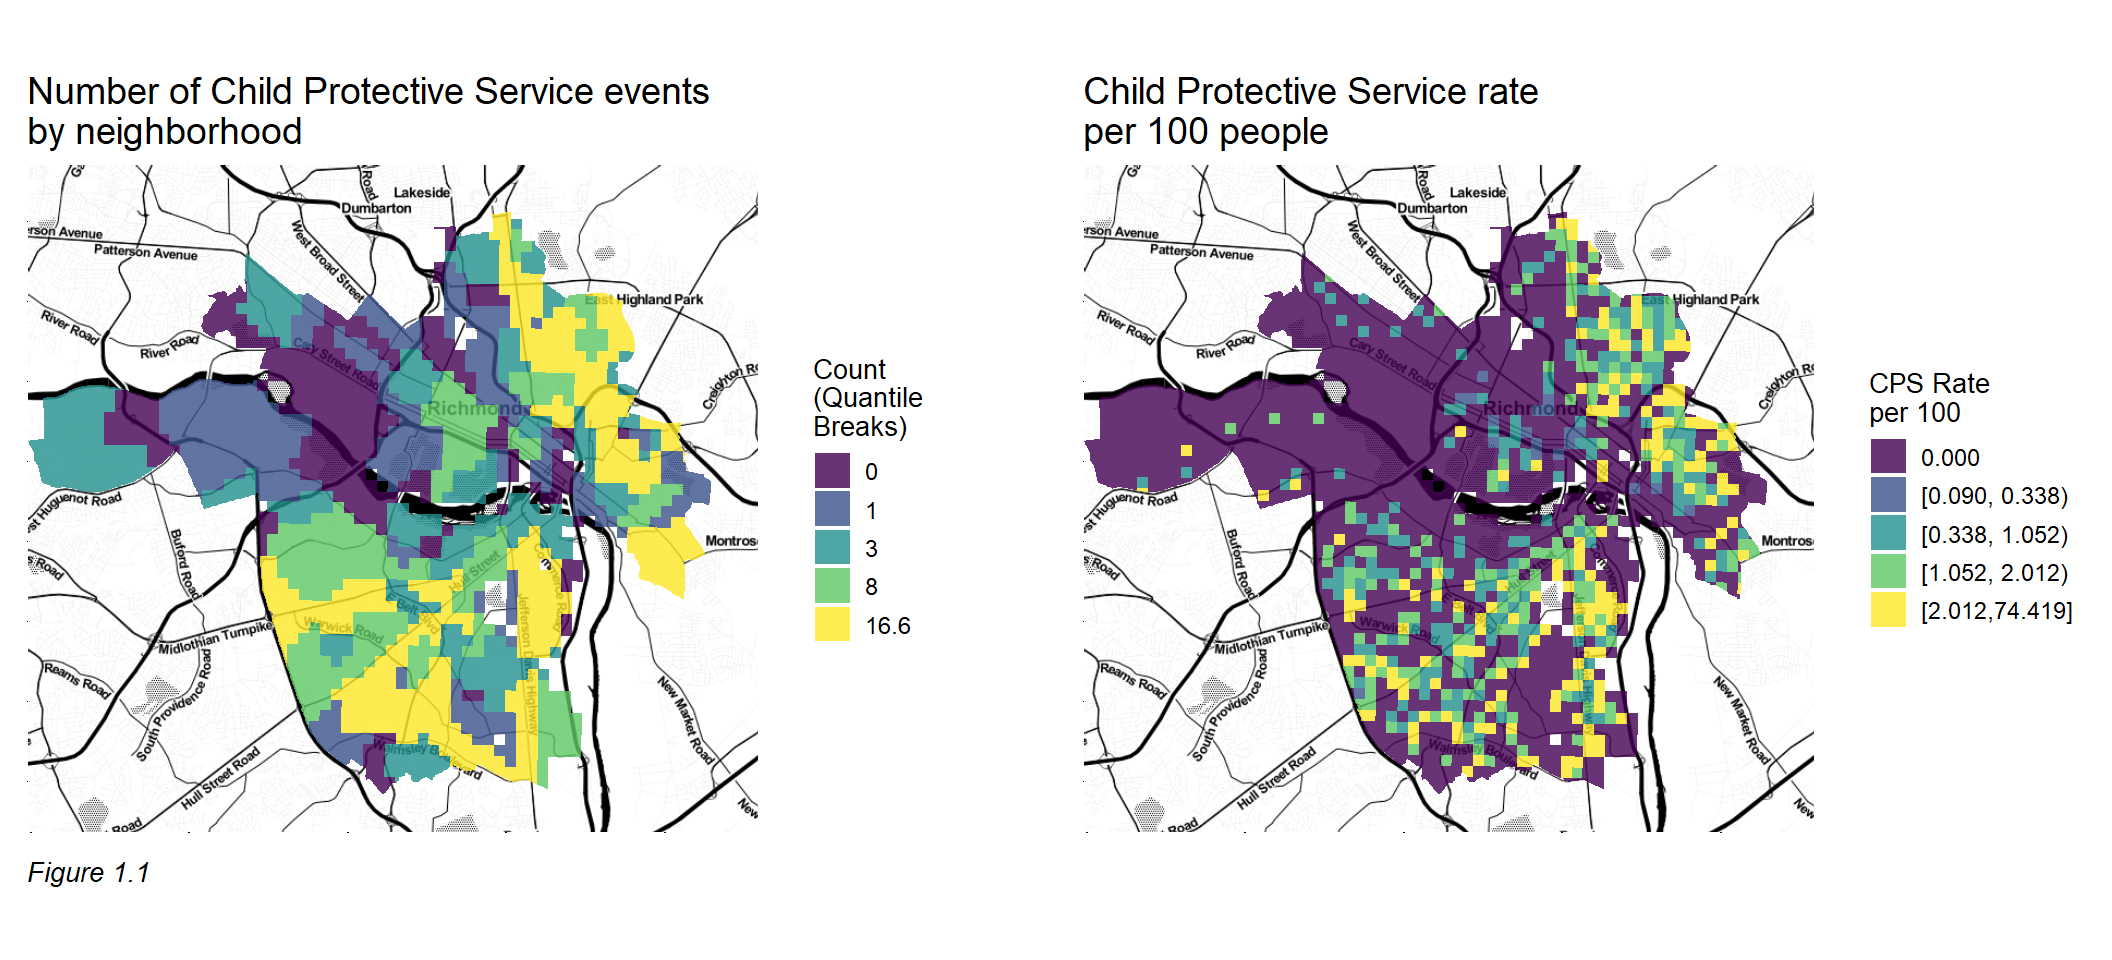
There are approximately 40,000 children in Richmond, VA, and between July 2013 and July 2017 there were 6,500 accepted cases of child maltreatment.1 Figure 1.1a shows the count of maltreatment events between 2013 and 2017 by neighborhood. Not all neighborhoods are affected by maltreatment in the same manner, as neighborhoods in the southwest and northeast of Richmond experience much higher counts of Child Protective Service (CPS) events. Can we do a better job ensuring that our limited child welfare resources are properly deployed to the communities where they are needed most?
To understand which communities have the greatest need, we must first determine where child maltreatment is likely to occur. There are a host of individual, family, and household level factors associated with child maltreatment, and research shows that community and social factors play an important role in understanding where maltreatment may occur.2 At high densities, externalities associated with ‘neighborhood effects’ can influence peers in close proximity.3
These externalities appear as maltreatment event clusters, as visualized in Figure 1.1b, which maps the rate of child maltreatment events in Richmond, VA between 2013 and 2017.4 Recent work shows that variation in these spatial clusters can be predicted by environmental factors such as crime, blight, and nuisance land uses like bars and restaurants.
There are two goals of the work presented here. First, to create a comprehensive open source framework for developing a child maltreatment predictive model to estimate maltreatment risk across Richmond.
The intuition for the model is to borrow the observed maltreatment ‘experience’ in Richmond and test whether those experiences are generalizable to places where maltreatment may occur but is not observed directly. If so, it is reasonable to confidently forecast maltreatment risk across space.
Second, to document a strategic planning process for converting maltreatment risk predictions into actionable intelligence stakeholders can use to efficiently allocate limited child welfare resources. In this ‘Align’ phase of the framework, we assess the extent to which the current supply of child welfare services is properly distributed relative to the demand for these services.
Modeling
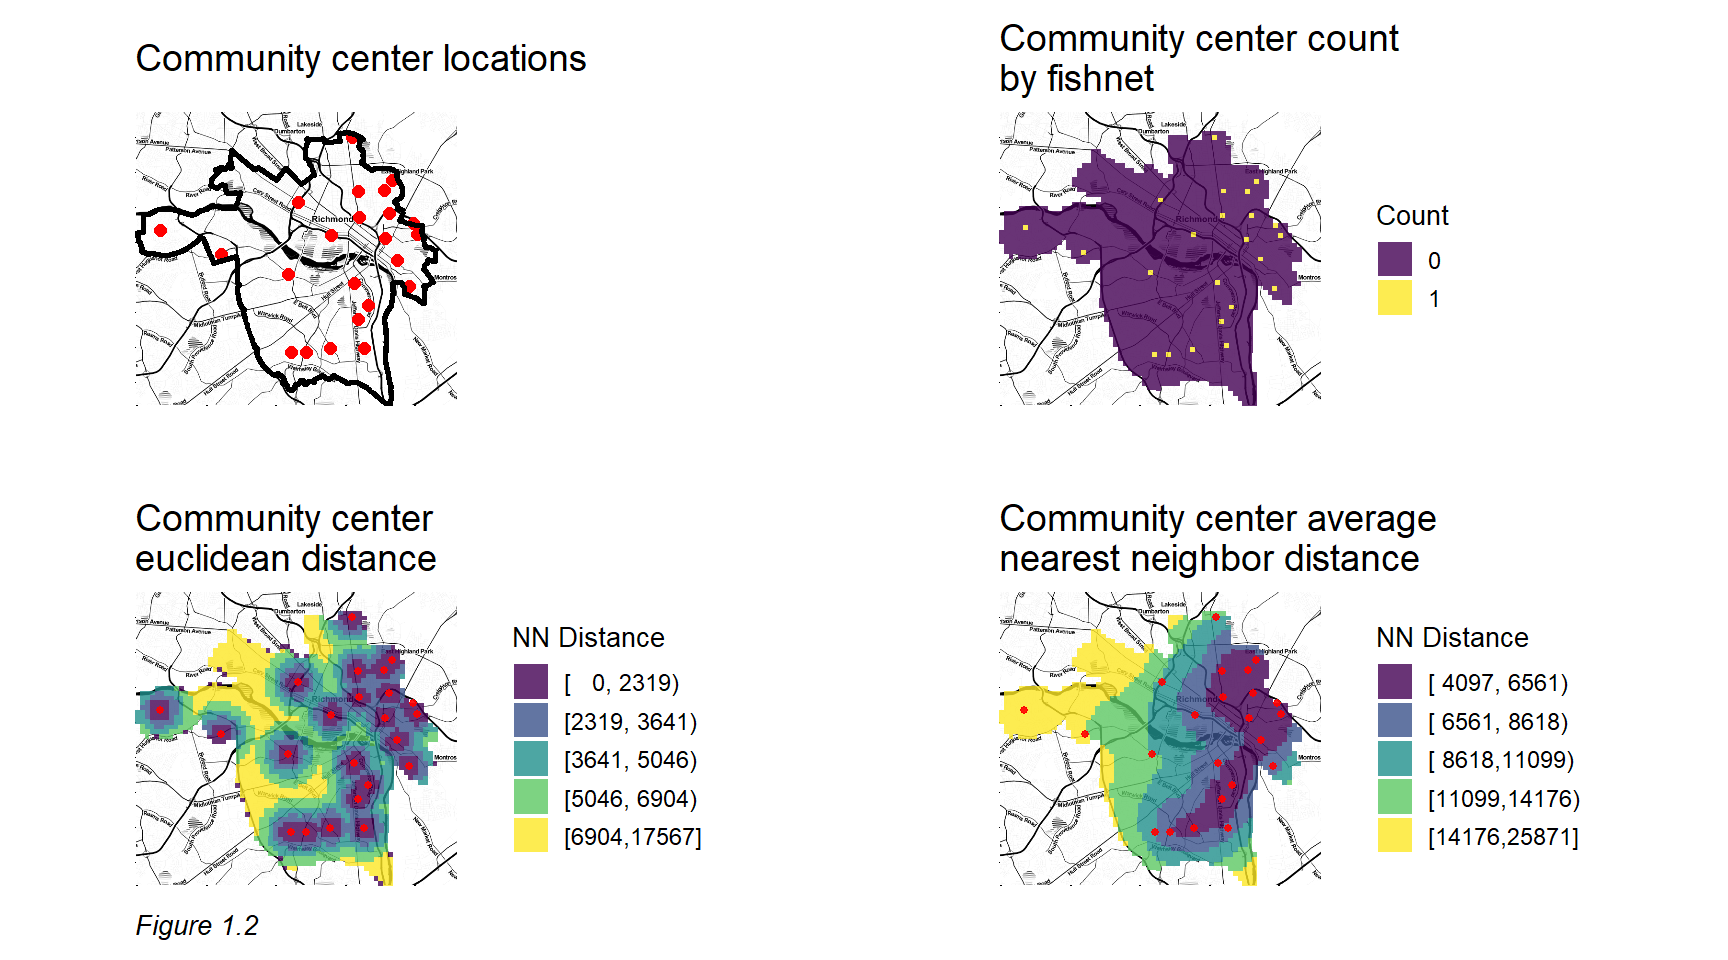
The predictive model is based on this notion of spatial externalities, positing that maltreatment risk is a function of exposure to certain environmental factors like crime and blight. Point data describing these environmental phenomena are aggregated to a regular lattice grid and engineered into a set of spatial ‘features’ from which predictive relationships can be mined. Figure 1.2 provides an example of the feature engineering process, mapping community center locations and recoding these locations so that every grid cell citywide receives three complementary measures of geographic ‘exposure’.
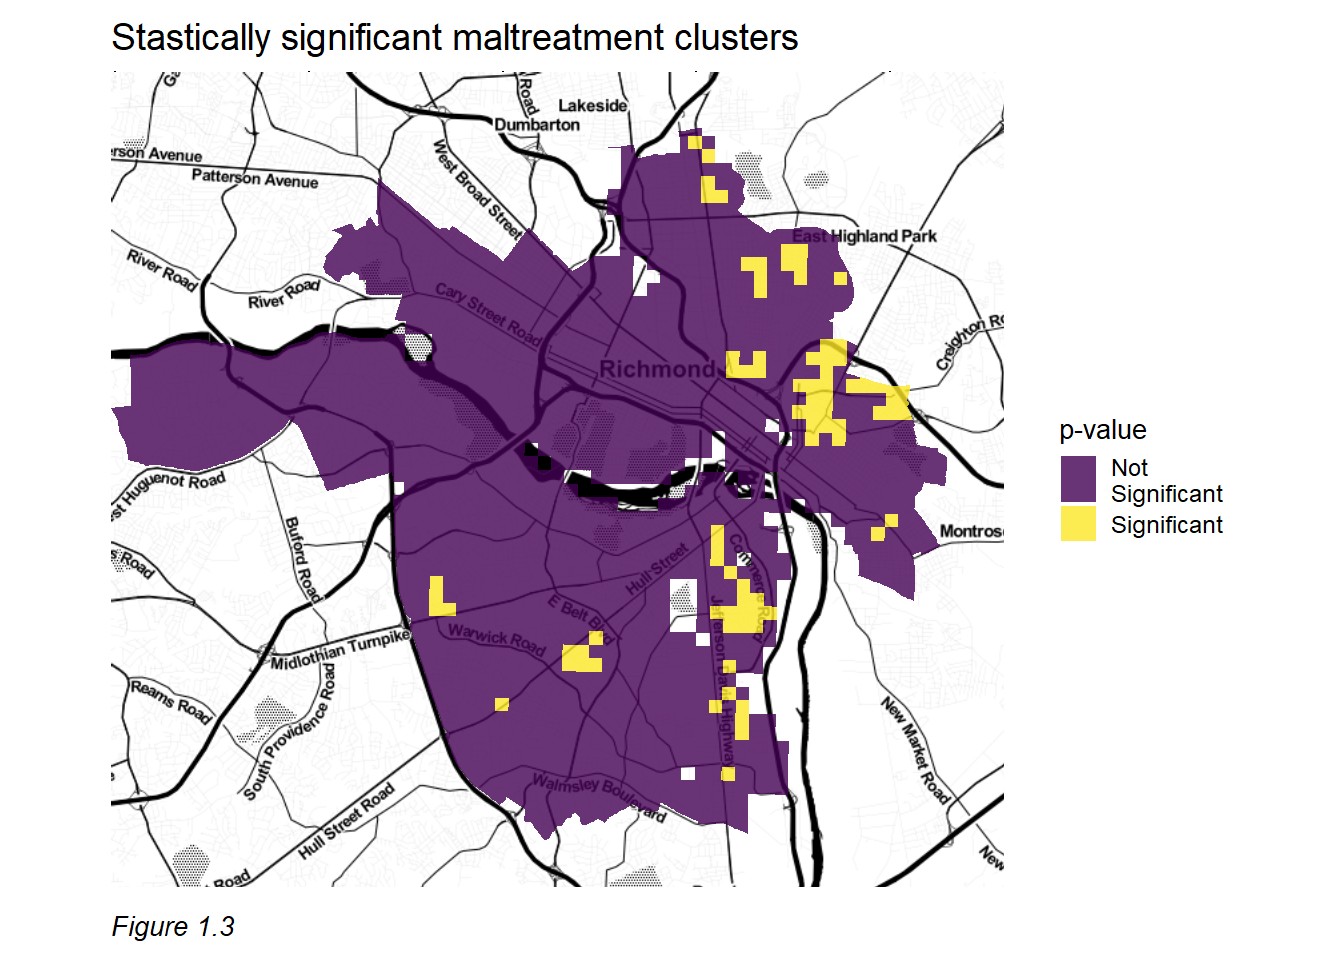
Prior to building any models, maltreatment events in Richmond are explored using various methods. We begin by analyzing maltreatment clusters to better understand the relevant spatial process. Figure 1.3 illustrates the location of statistically significant maltreatment event clusters across Richmond. These are locations where maltreatment occurs in higher densities than we might expect due to random chance alone.
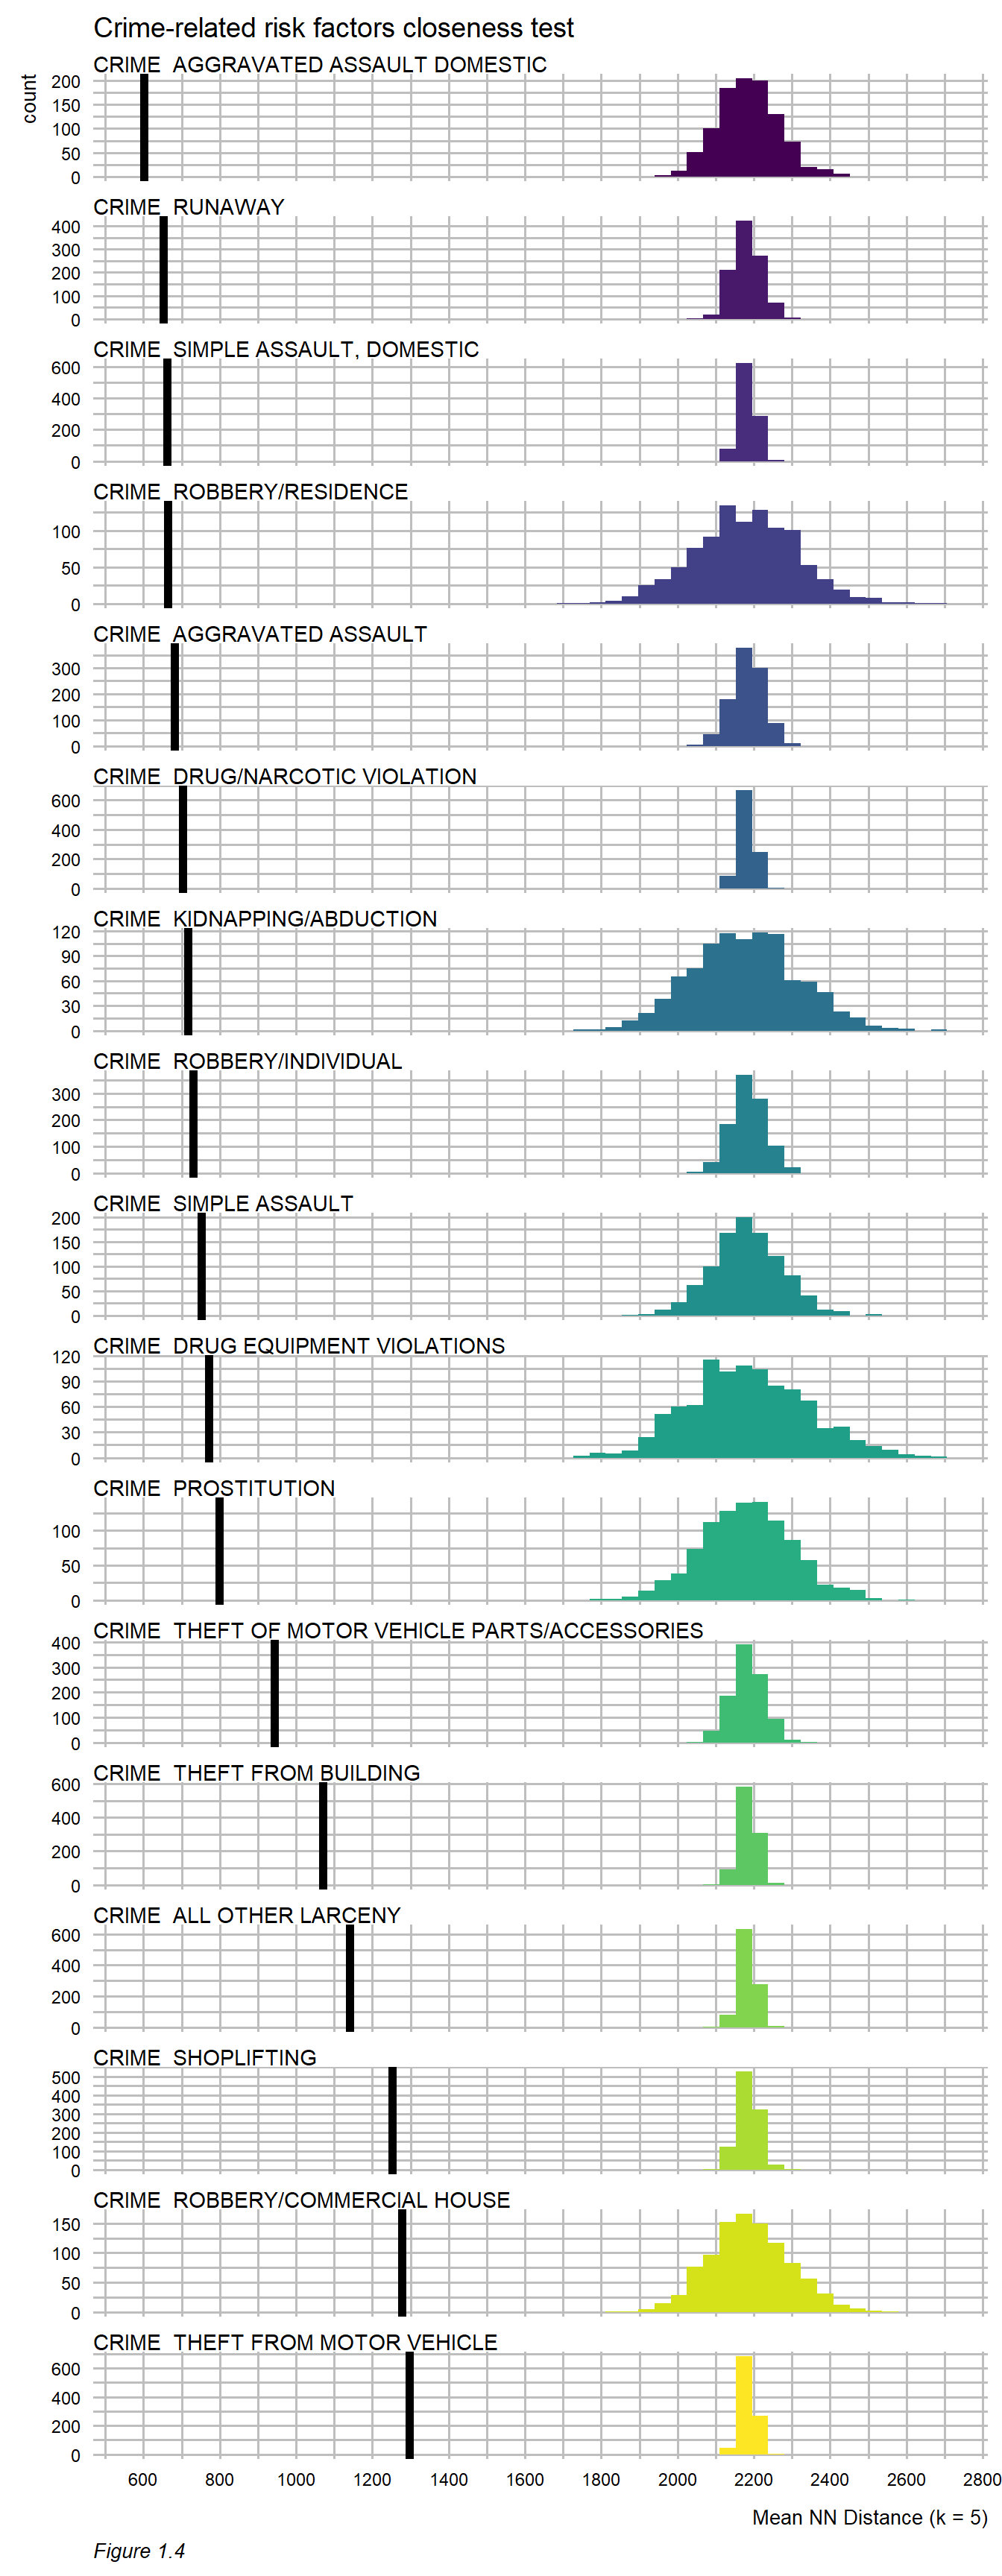
We also analyze the extent of colocation between maltreatment and measures of exposure to determine whether a given factor is ‘closer’ to a maltreatment event than what we might otherwise presume due to random chance alone. This is a useful, policy-centric approach for understanding how phenomena are associated with maltreatment across space.
For example, Figure 1.4 ranks crime-related factors by their average distance to maltreatment. We provide more statistical intuition for this test in Section 5, however for now, it is interesting to point out that several domestic-oriented crimes occur in close proximity to maltreatment.
Once we understand the patterns within the maltreatment data, several linear and non-linear machine learning algorithms are estimated. For each model, a set of ‘goodness of fit’ metrics are recorded that describe the tradeoff between model accuracy and generalizability across space.
At the heart of the analysis is the tradeoff between accuracy and generalizability. A model that is perfectly accurate will not reveal areas where children may be at risk despite a lack of reported maltreatment. A model that is perfectly generalizable may fail to provide targeted intelligence to identify areas at serious risk for maltreatment.
Accuracy is defined as the model’s ability to minimize the difference between the observed count of maltreatment events and the predicted count. These differences are referred to as ‘errors’ and significant attention is paid to their nuances in Section 4 and Section 6. Generalizability refers to the model’s ability to make comparable predictions across neighborhoods regardless of differences in factors like income and race. Several of these ‘cross-validation’ metrics are calculated, visualized, and explained in Section 6.
Results
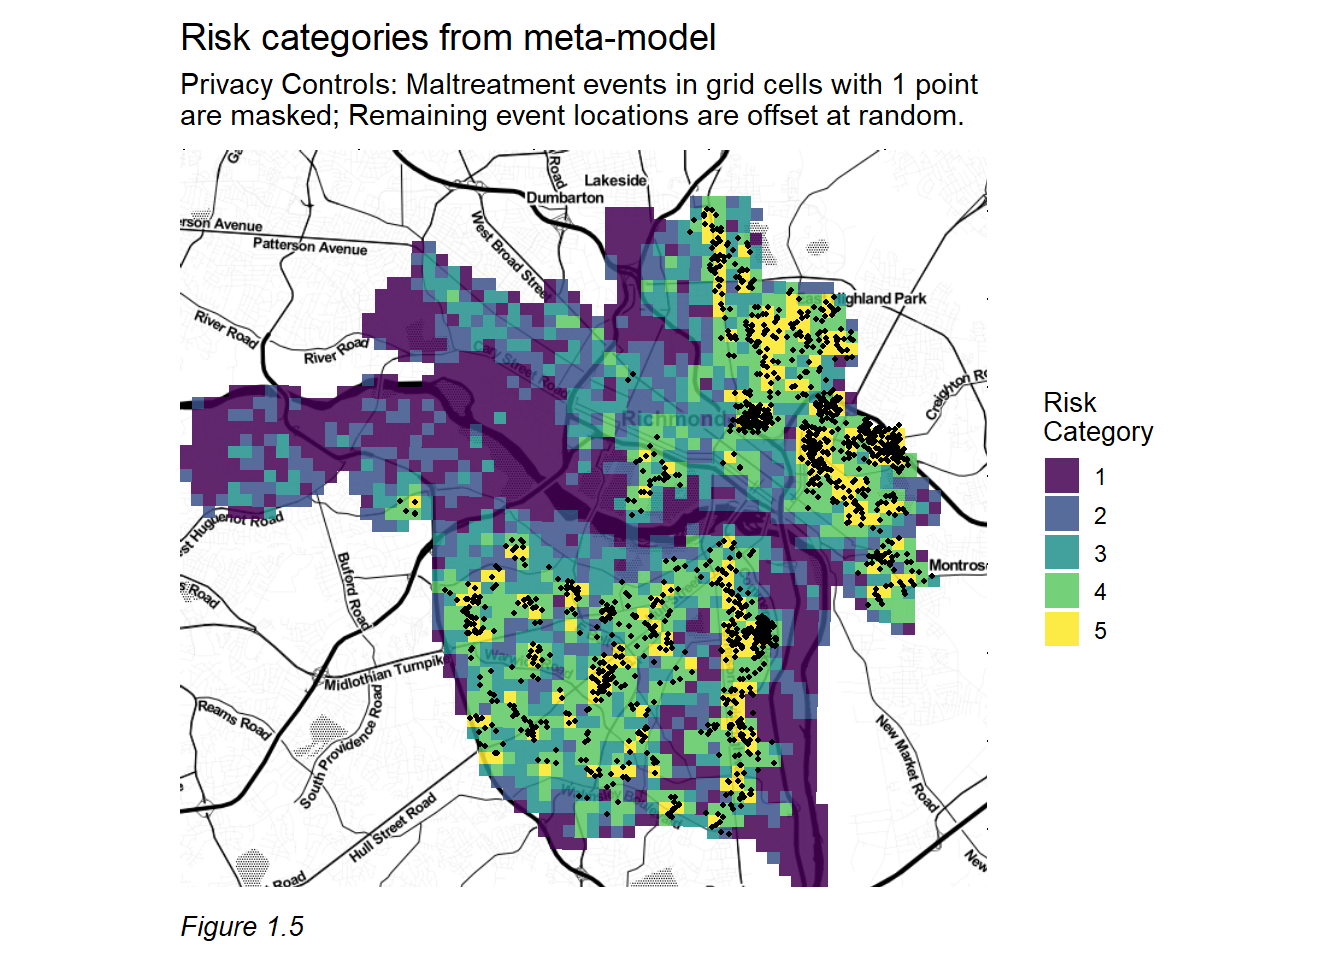
By focusing on the tradeoff between accuracy and generalizability, the final predictive model produces highly targeted spatial risk predictions. These risk predictions are split into five risk categories – 5 being the greatest risk. Figure 1.5 maps these categories and overlays a set of maltreatment events that were withheld from the model for the purposes of validation. The map suggests that our model predicts well, evidenced by the many holdout maltreatment events that fall in the highest predicted risk category.
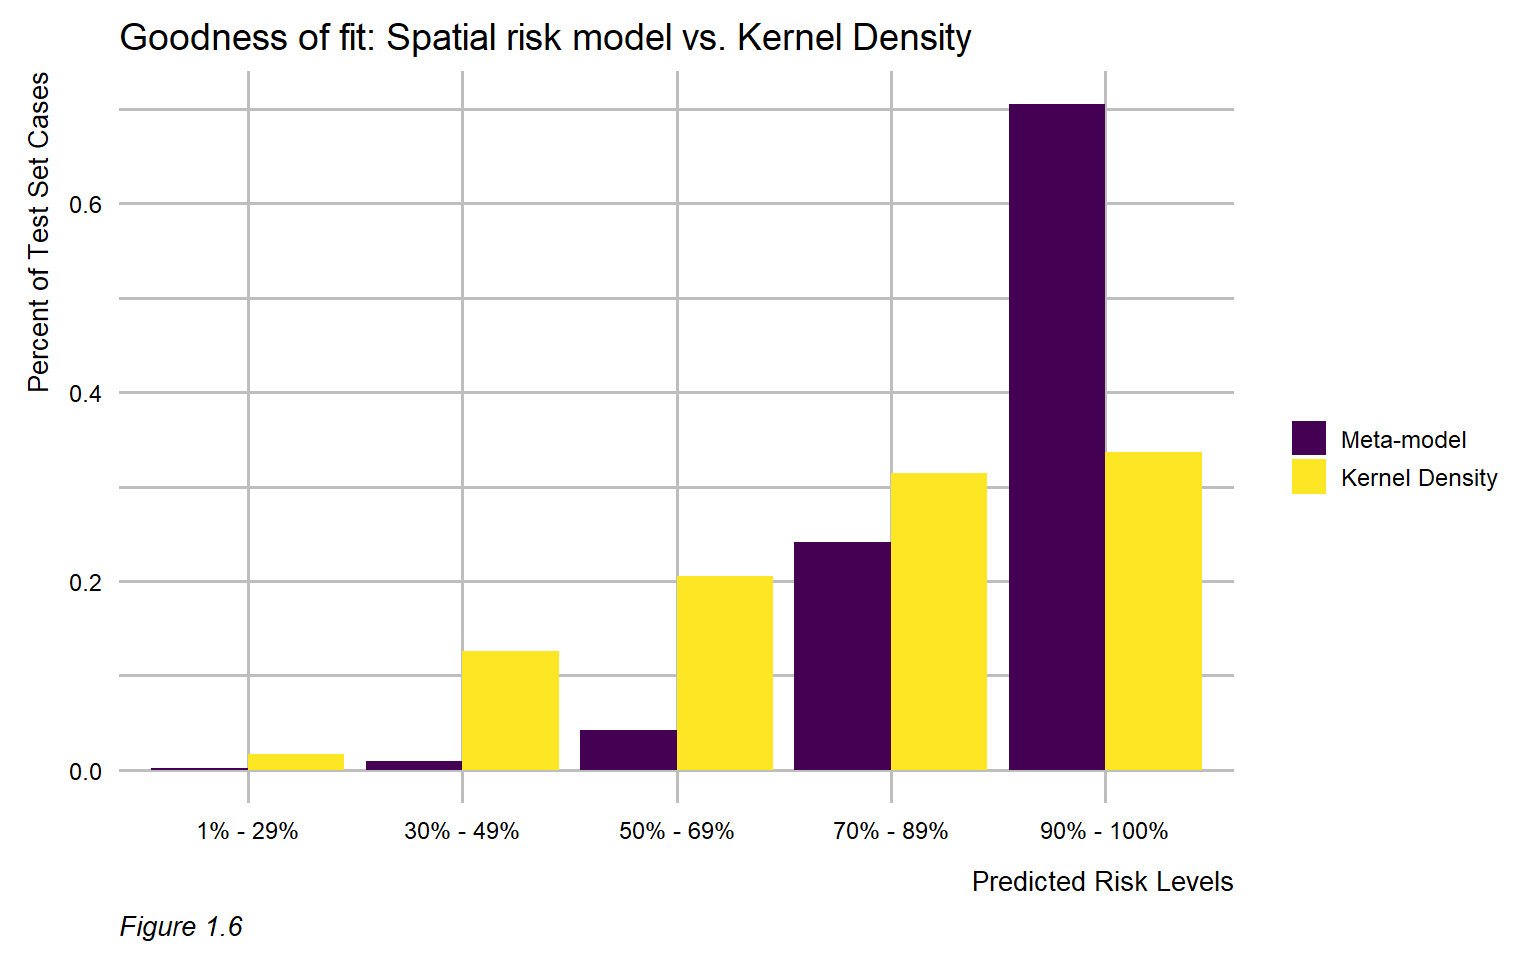
This visual relationship is further formalized by comparing the model predictions to those derived from a simple Kernel Density Estimation (KDE) – a common tool used to convert point data into hot spot maps. The ubiquity of KDE as a tool for spatial targeting makes it a useful baseline to which model predictions can be compared.
Both the KDE and the risk predictions are split into five risk categories, and the proportion of holdout maltreatment events are calculated for each category. The plot below shows that for the highest risk category, the meta-model captures approximately 70% of the observed maltreatment events, whereas the KDE captures only about 35%. For context, approximately 8,200 children live in the high risk category which represents about 21% of total children in Richmond, but only about 10% of the total area of the city.
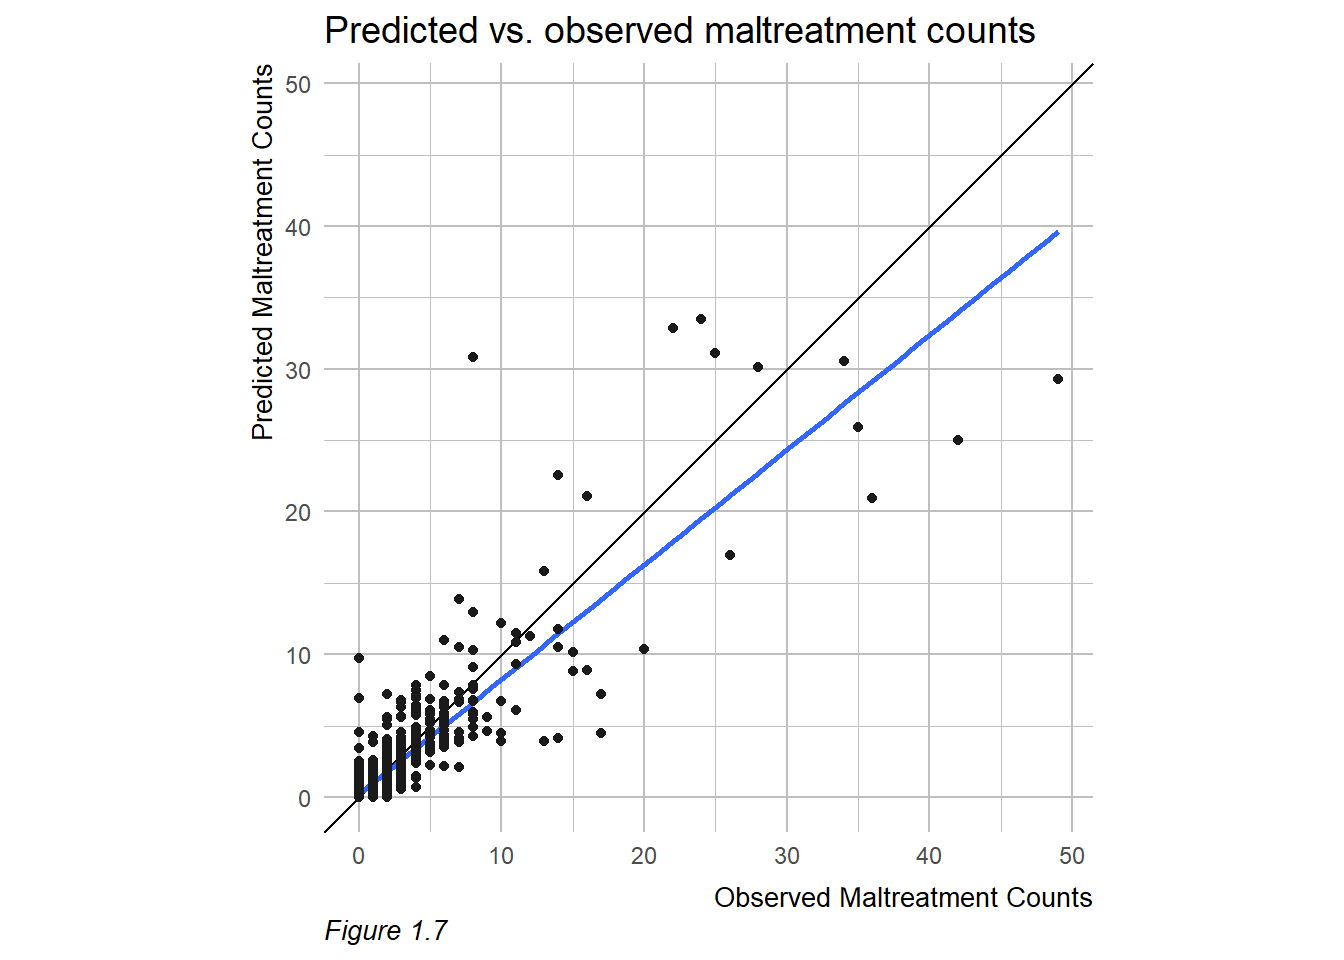
Other useful metrics are created to evaluate model performance. Our most useful predictive model has an average (absolute value) error of 0.533 of one maltreatment event. We believe this outcome is representative of a highly accurate model that is capable of producing policy-relevant risk predictions. However, it is difficult to evaluate model performance across communities with varying maltreatment rates using only this metric.
Rather, Figure 1.7 displays a simple evaluative measure for the final model – visualizing predicted maltreatment counts as a function of observed counts. The black line that intersects the point cloud represents a perfect prediction, while the blue line represents actual predictions. The model is accurate for most of the data (i.e. most of the city), but loses some fidelity in areas with very high maltreatment event counts.
We also develop several algorithmic fairness metrics to describe generalizability across space. Despite the models ability to rightfully predict high maltreatment risk in areas with high occurrence rates, we do see relatively higher errors in these places. The variability of (absolute value) error across Richmond neighborhoods is 0.746 of one event.
Another way of judging how well the model generalizes across space is to ask how well it performs in neighborhoods of varying typologies. We test the model looking for relative differences across high and low poverty rates and high and low minority rates, respectively. If the model generalizes well to these places, we should see similar accuracies across the varying typologies.
Results suggest that the model predicts equally well across neighborhoods of varying poverty levels. However, these metrics also indicate that the model predicts less accurately in certain minority neighborhoods, particularly those with disproportionately large maltreatment counts. The nature of this finding is discussed in detail in Section 6, and additional approaches for adding more equity into the model are proposed. An independent ethicist has reviewed the approach and found that the framework delivers ‘genuine benefits while avoiding some of the familiar risks of alternative approaches to targeting child protection services.’
Align
Using the knowledge from the predictive model, we develop a strategic planning framework, embedding the risk predictions into a larger analysis describing whether the supply of child welfare services is properly aligned with the demand for these services. Demand in an area is defined by the risk predictions. We define supply as the presence of protective land uses – places stakeholders could deploy education, treatment, and prevention resources.
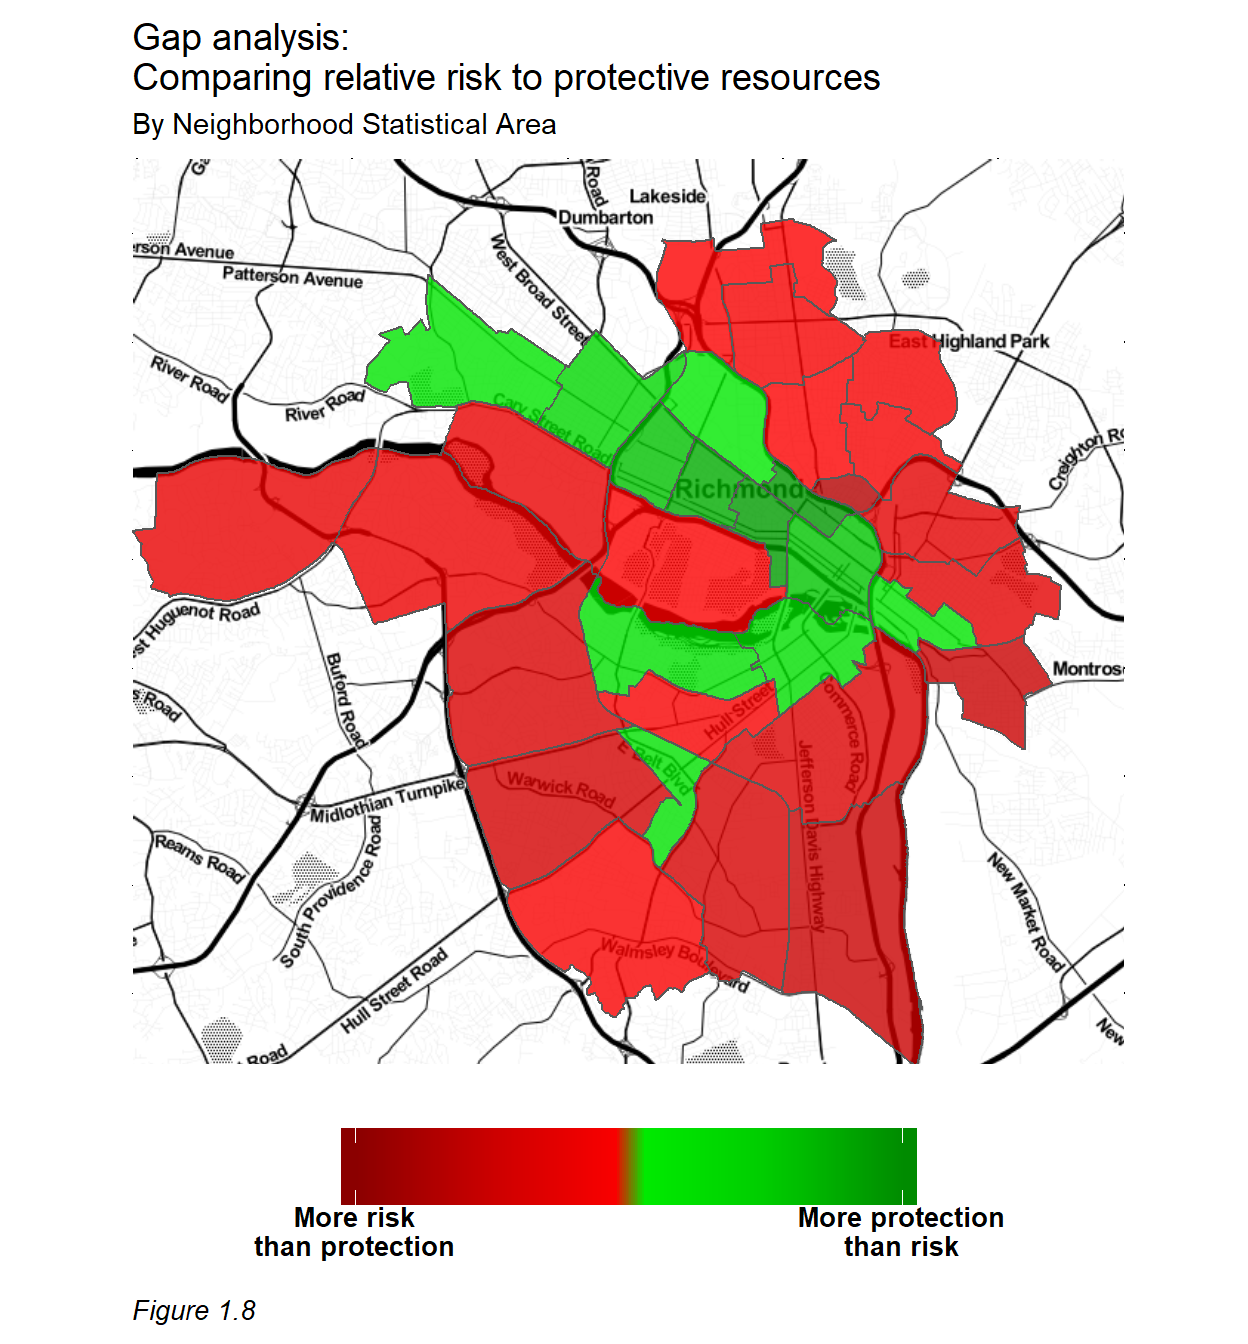
One way to characterize alignment is to scale these indicators of supply and demand and relate them to each other at the neighborhood level. Figure 1.8 displays the resulting relationship. Light red and light green neighborhoods are those where there is a strong alignment between the supply of and demand for child welfare services. Dark green places are those where there are more protective resources than risk, and dark red areas are places where maltreatment risk outweighs the availability of protective resources.
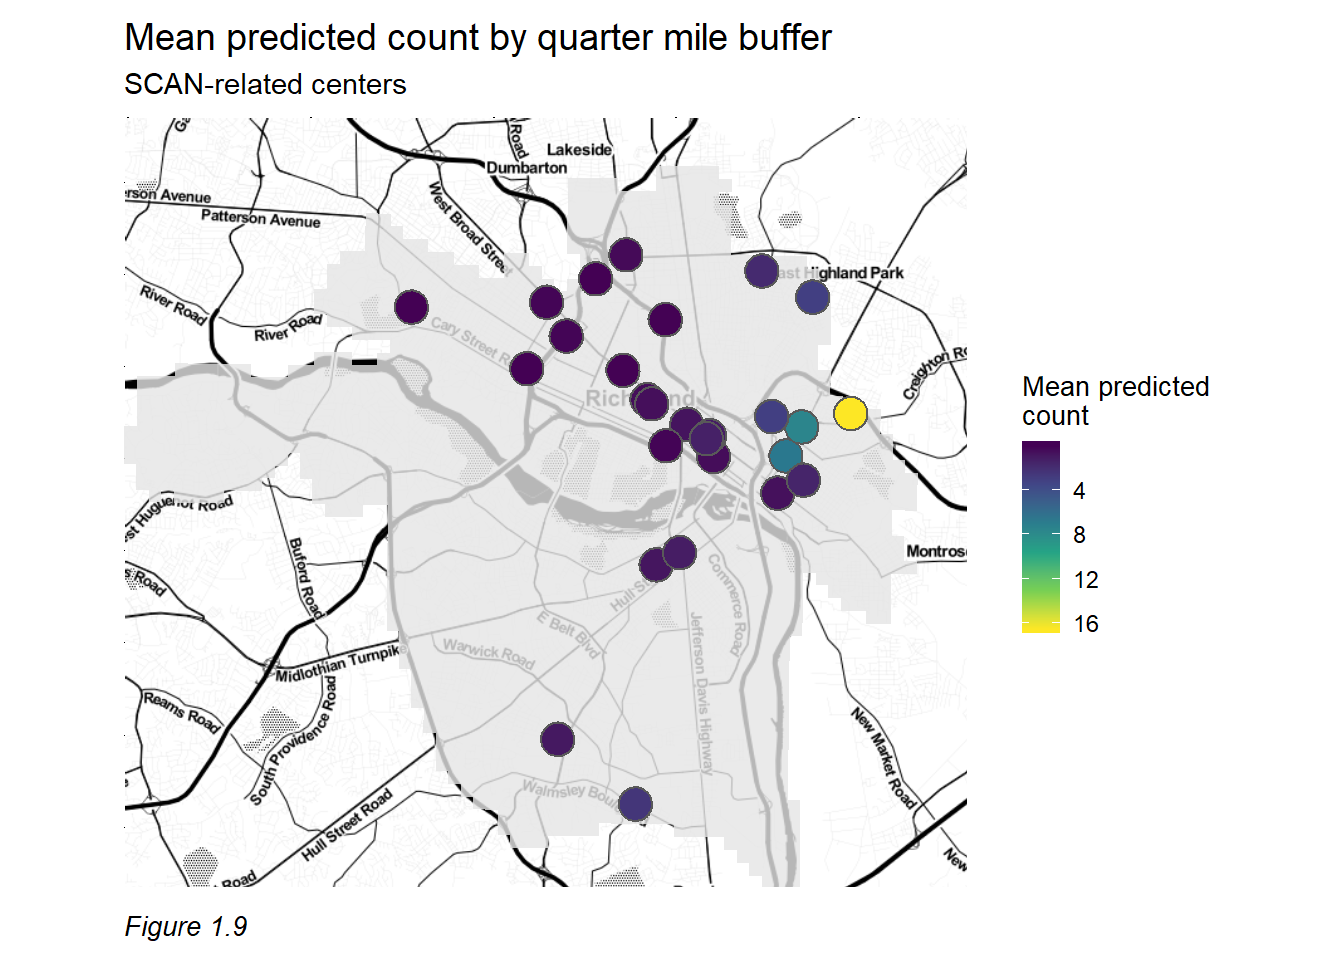
This method suggests that protective resources are not always in optimal locations. To get a clearer picture we examine Stop Child Abuse Now (SCAN) Centers (Figure 1.9). The SCAN mission is to ‘prevent and treat child abuse and neglect throughout the Greater Richmond area by protecting children, promoting positive parenting, strengthening families and creating a community that values and cares for its children.’ While this organization provides an invaluable service, when mapped in the context of risk, it appears some of these centers could be better allocated to communities at greater risk for maltreatment.
The next section provides and discusses more of these Align analytics, which stakeholders can easily develop by bringing a digital map file of risk predictions into a standard desktop GIS system. We believe this framework can have important impacts on the child welfare strategic planning process in Richmond.
In the sections to follow, we delve deeply into the spatial risk predictive model developed for this project. We provide some motivation, contrasting predictive modeling to traditional research, and present a very robust methods section situating our framework in the literature on spatial analysis and spatial prediction. Next, we discuss our exploratory analysis and finally, results are examined at length.
Ken Steif, PhD is the founder of Urban Spatial. You can follow him on Twitter @KenSteif. He is the Program Director of the Master of Urban Spatial Analytics program at the University of Pennsylvania.
This work was completed in collaboration with Dyann Daley and Predict Align Prevent. We are grateful to Matt Harris, who spent many hours collaborating on the algorithmic approach and code base. In addition, thanks to Sydney Goldstein who helped author the report and ensure its visual appeal.