Let’s say you wanted to open up a new restaurant in Philadelphia. Where would be a good location? In this demo, we’ll see two ways of performing a ‘site-suitability’ analysis.
The first uses a tradition spatial analytical approach and the second uses predictive analytics. The difference between the two is critical: While the former relies on the analyst’s assumptions about which locational factors are important, the latter allows the data to dictate what’s critical.
Decision factor site suitability
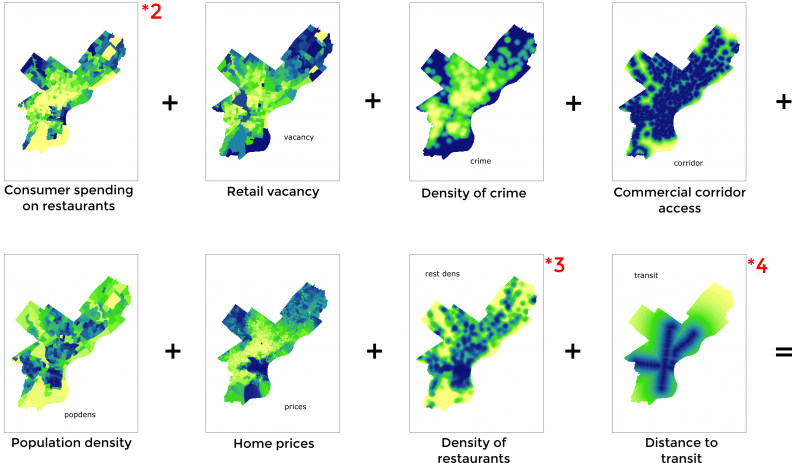
The traditional site suitability approach uses individual spatial ‘decision factors’, each comprised as a set of raster’ images just like a digital photograph. Because each decision factor has the same pixel size, they can be scaled, overlaid and combined into one final site suitability map.
Below we’ve developed 8 decision factors describing locational characteristics in Philadelphia. Imagine that we hired the very best GM in the restaurant business to tell us that three of these factors should be weighted as more important. We can scale, weight and combine these factors as prescribed:
The resulting restaurant site suitability map looks like this:
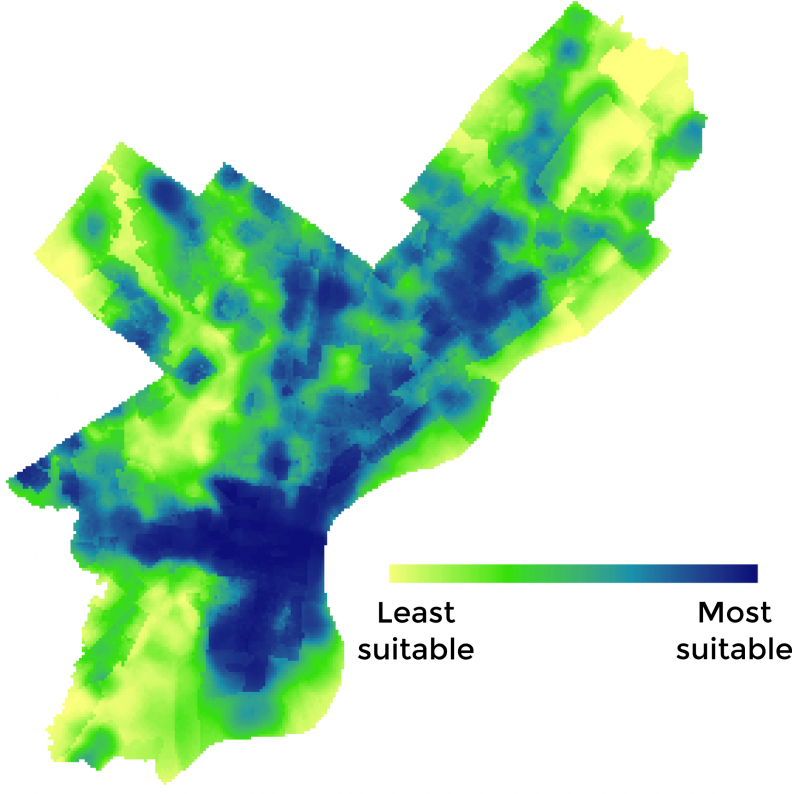
This is great. The GM has told us where our new restaurant is likely to succeed and now we have a site suitability score associated with every place in Philadelphia. While this is a good start, predictive modeling doesn’t need to rely on expert opinion alone. It can backward engineer the important factors and weight them accordingly based on actual restaurant outcomes in Philadelphia.
Predictive site suitability
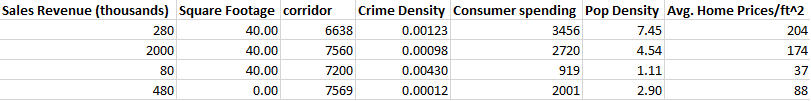
Let’s do the analysis again, but this time we’re going to use some simulated data on restaurant locations and sales revenues citywide. The idea is to explicitly model the venue-specific and locational characteristics that underlie restaurant sales revenue. Ultimately, we predict sales revenue for a series of available restaurant properties currently on the market. To accomplish this we’ll build a dataset similar to the one illustrated below.
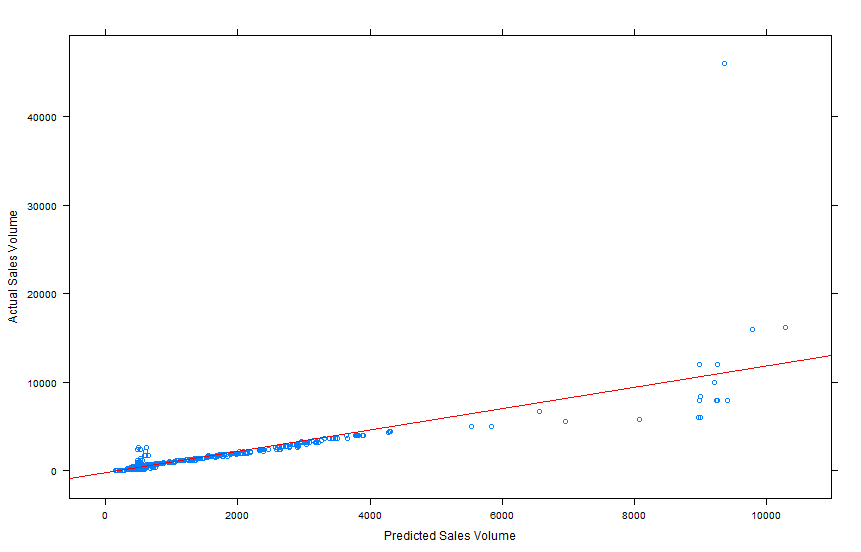
Once the dataset is built, the next step is to build some models and test the extent to which it’s statistically reasonable to use restaurant sale revenue outcomes to predict revenues for proposed restaurants. A series of metrics like the graph below reveal how accurately we predict. When we compare predicted (x-axis) vs. actual sales revenues (y-axis), we discover that although the model under-predicts for higher end establishments, overall our predictions are fairly accurate.
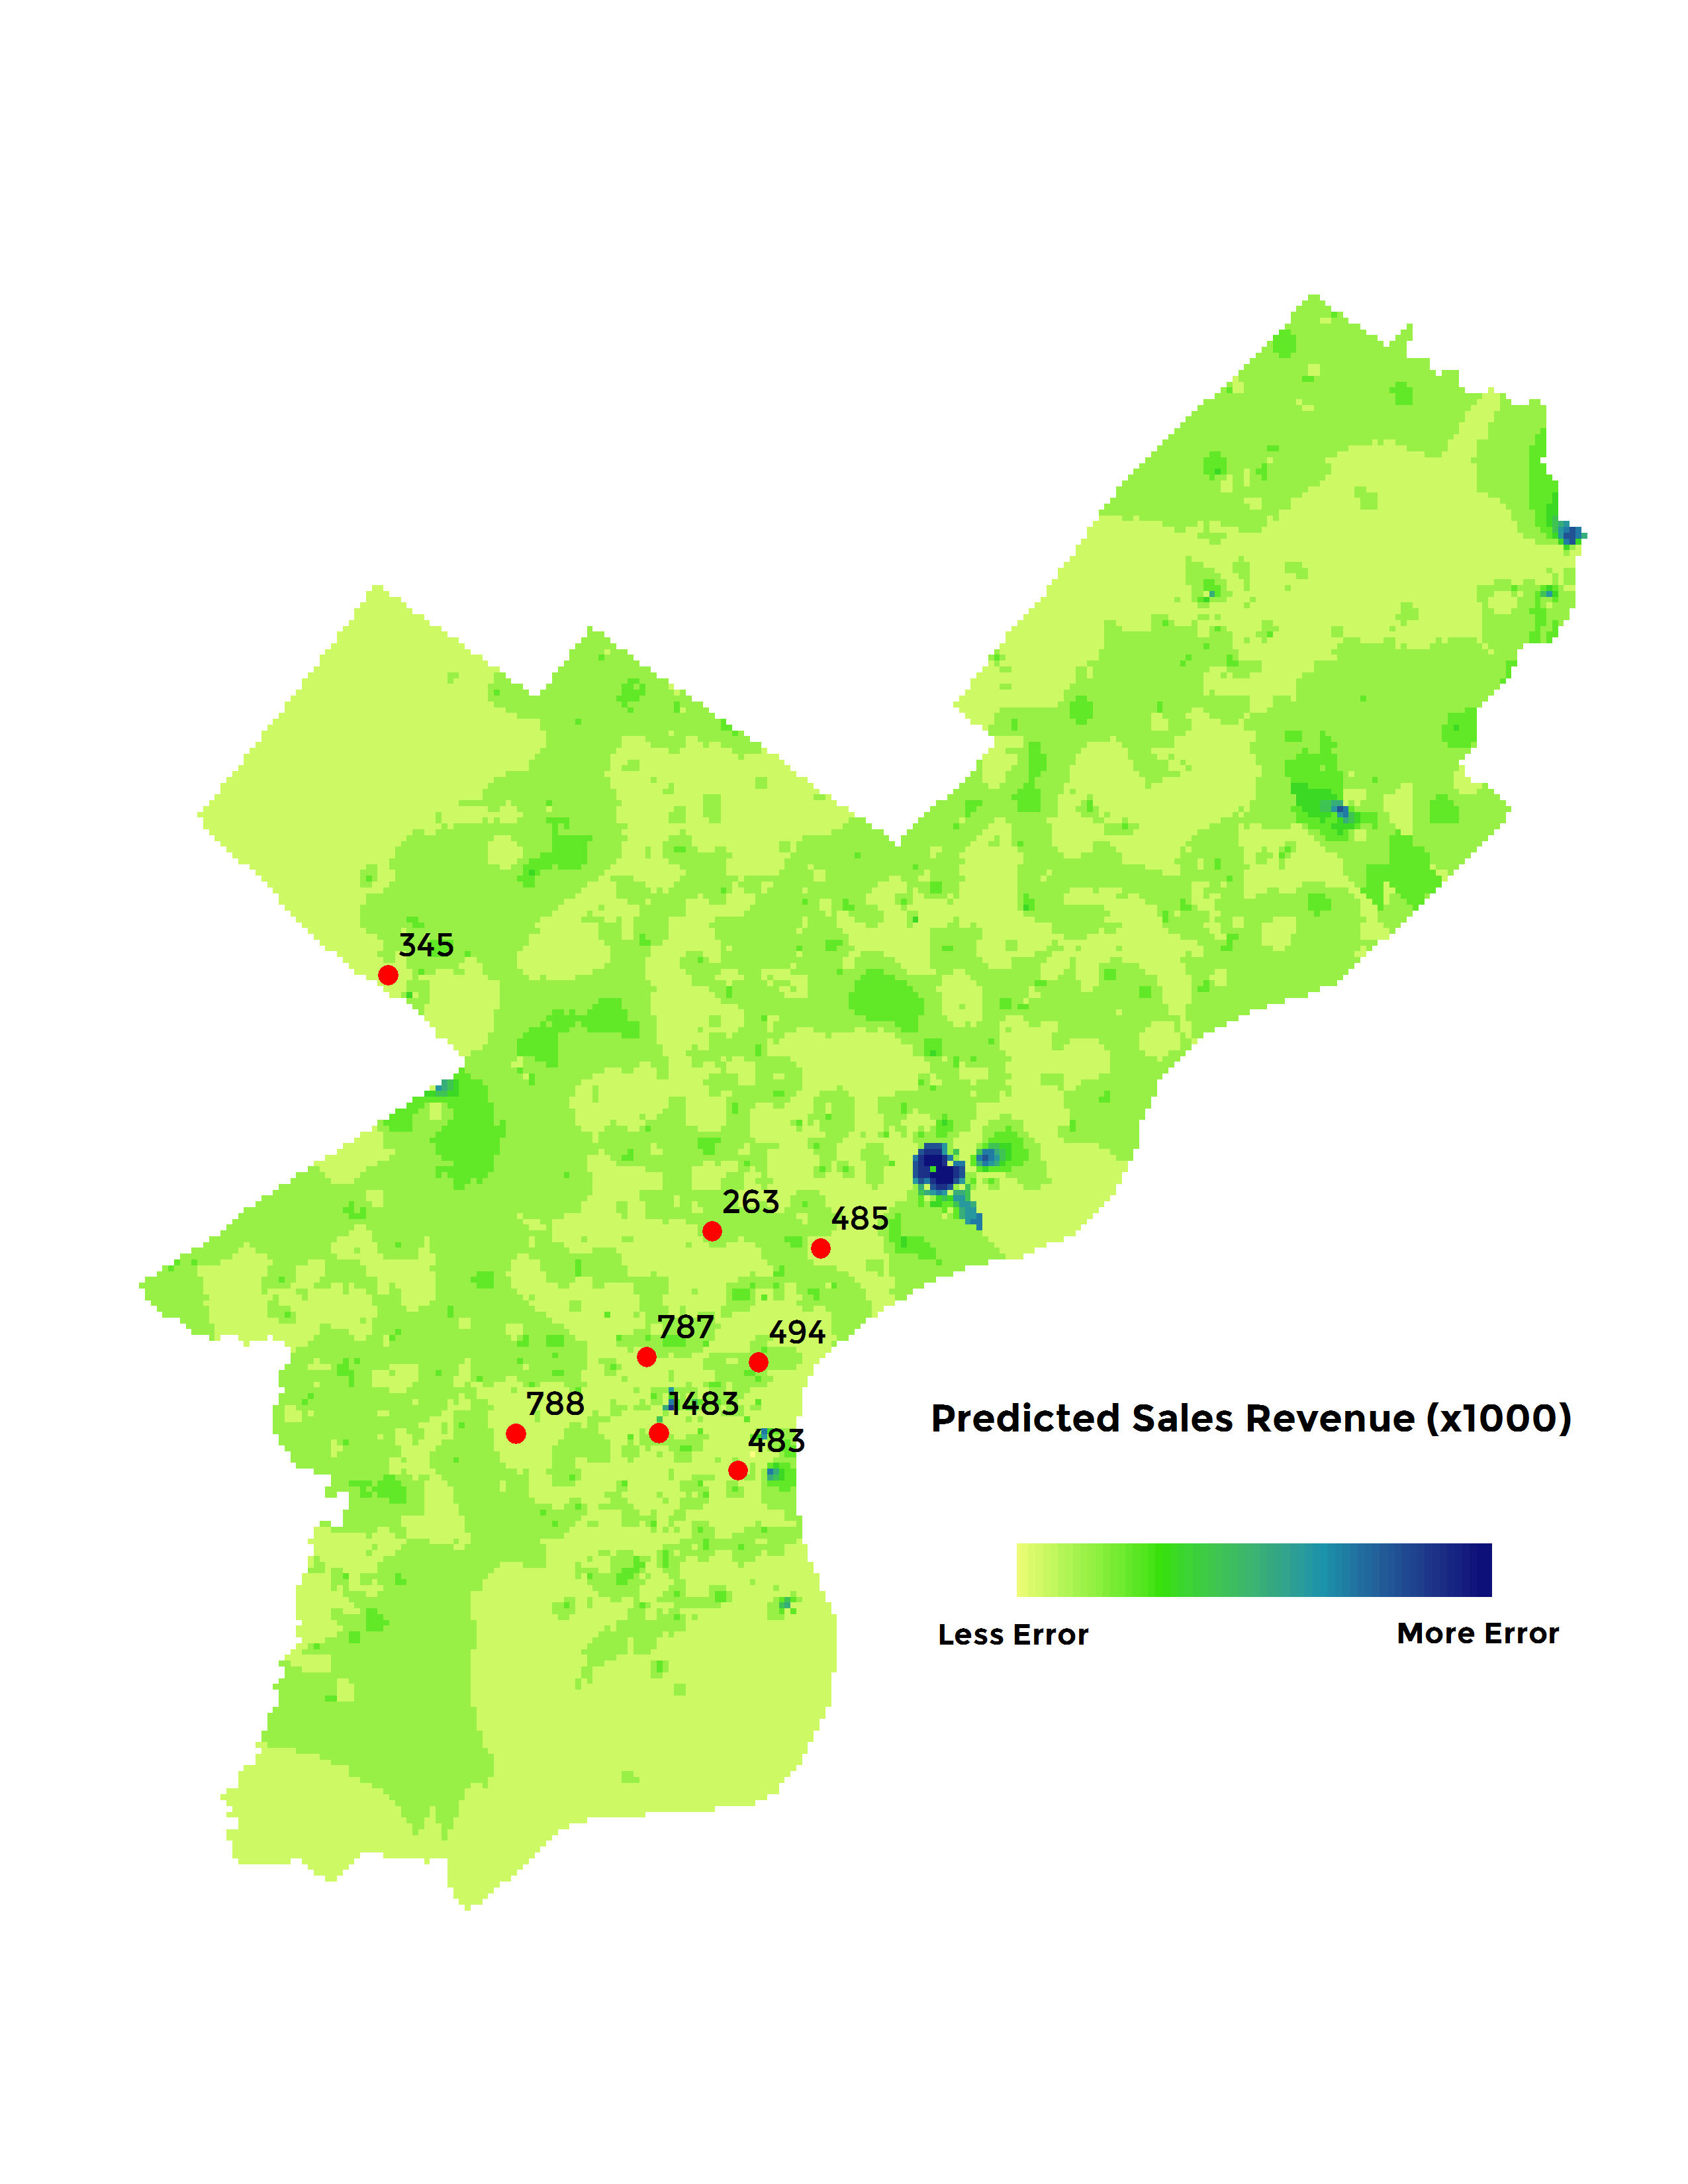
Once we’re satisfied with our predictive model, the local real estate agent gives us a short list of available properties throughout Philadelphia. We can then use the model we just ‘trained’ to predict sales revenue for each of these available properties. As an added bonus, the nature of the statistical model reveals the amount of predictive error in our model. We can interpolate this prediction error across the entire city as seen in the map below.
The predictive analytics approach has provided us with real actionable intelligence which we can use to further sharpen our business plan. What makes this type analysis reasonable is that we’re not predicting over time per se – we’re predicting across space. In other words, we’re borrowing the economic experience from existing restaurants, and testing the extent to which those experiences are applicable in areas where restaurant outcomes are unknown.