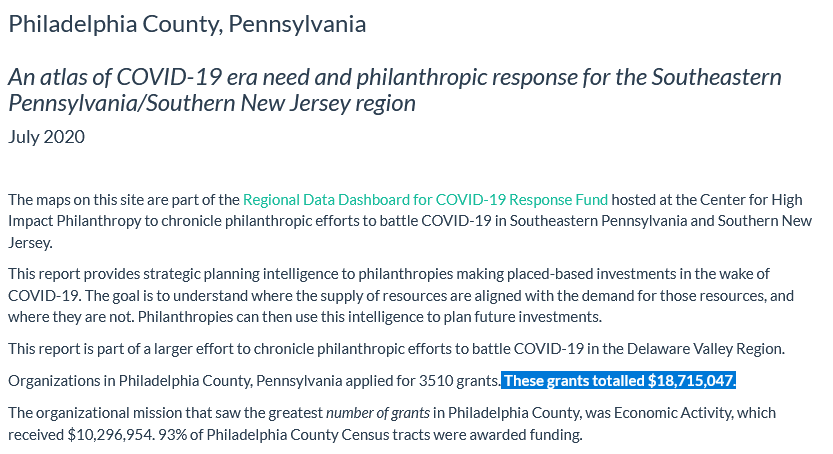
COVID-19 mobilized Philadelphia’s philanthropic sector, who in the months following the onset of the pandemic made nearly $40 million worth of grants across the region. Which communities received grants? For what purpose? How can strategic planning analytics help future grantmakers guide resources where they are most needed?
In a project driven by the University of Pennsylvania’s Center for High Impact Philanthropy and the Actionable Intelligence for Social Policy, Urban Spatial built a custom, web-based geographic information system to help answer these questions.
Several participating stakeholders suggested this was the first time they had seen philanthropies sharing grantmaking data, which revealed an opportunity to develop powerful planning tools, both amid a pandemic and into the future.
Understanding that analytics may be relatively new in this sector, the GIS was designed to be accessible for users with varying digital skillsets. Use case 1 provides user-friendly metrics in a sparkline table that compares COVID outcomes and need across counties.
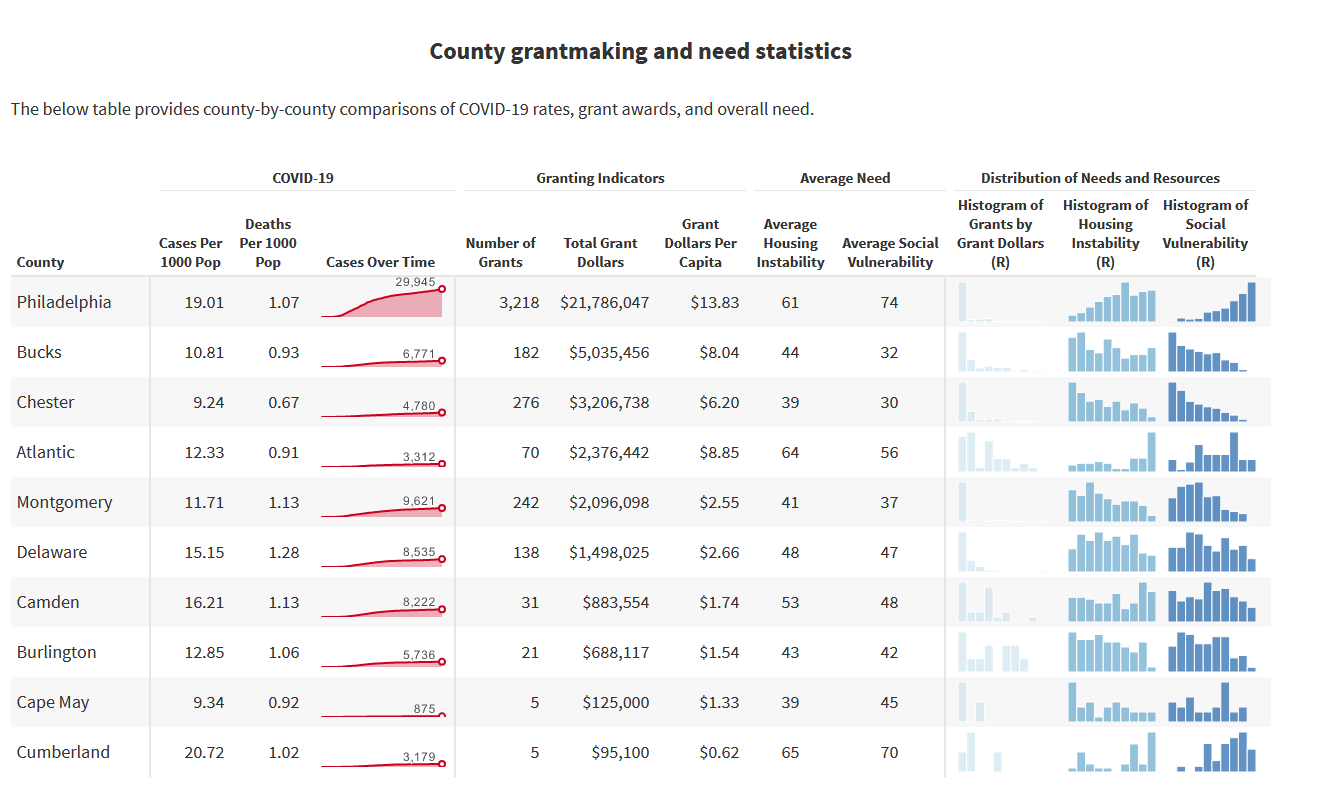
The table contrasts resource ‘demand’, mapping the geography of COVID-19 cases, housing instability and social vulnerability, with resource ‘supply’ defined as the geography of grantmaking (only a portion of grants could be geocoded). With these notions of supply and demand, strategic planning analytics were developed to map areas where need exceeded granting and vice versa.
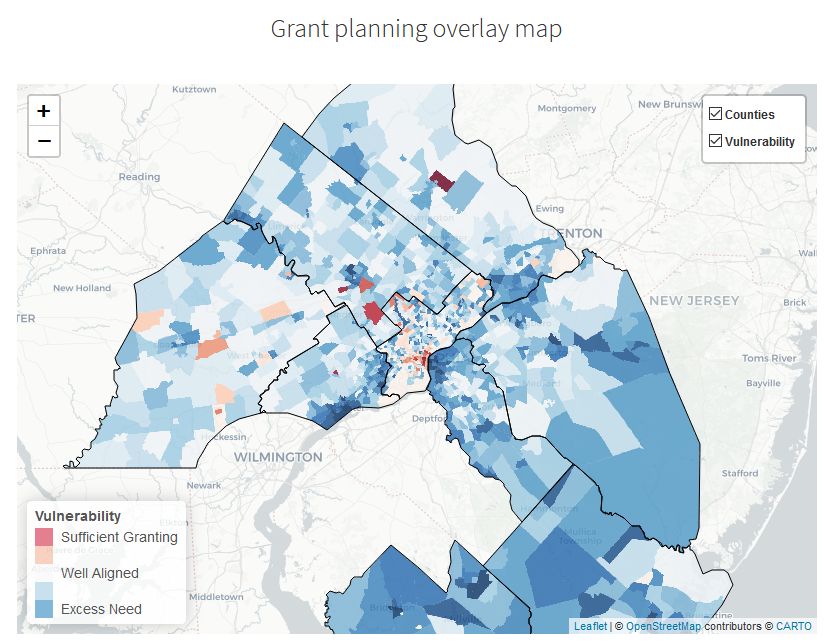
In the map above, places in red are those where there was more relative granting than need. Darker blue areas are those where relative need (here as a Social Vulnerability Index) outweighs relative granting. Use case 2 embeds these maps with a wealth of other need and grant-based indicators in a set of reproducible R Markdown reports broken out by County. These reports were written so that all metrics could be updated automatically as data changed.
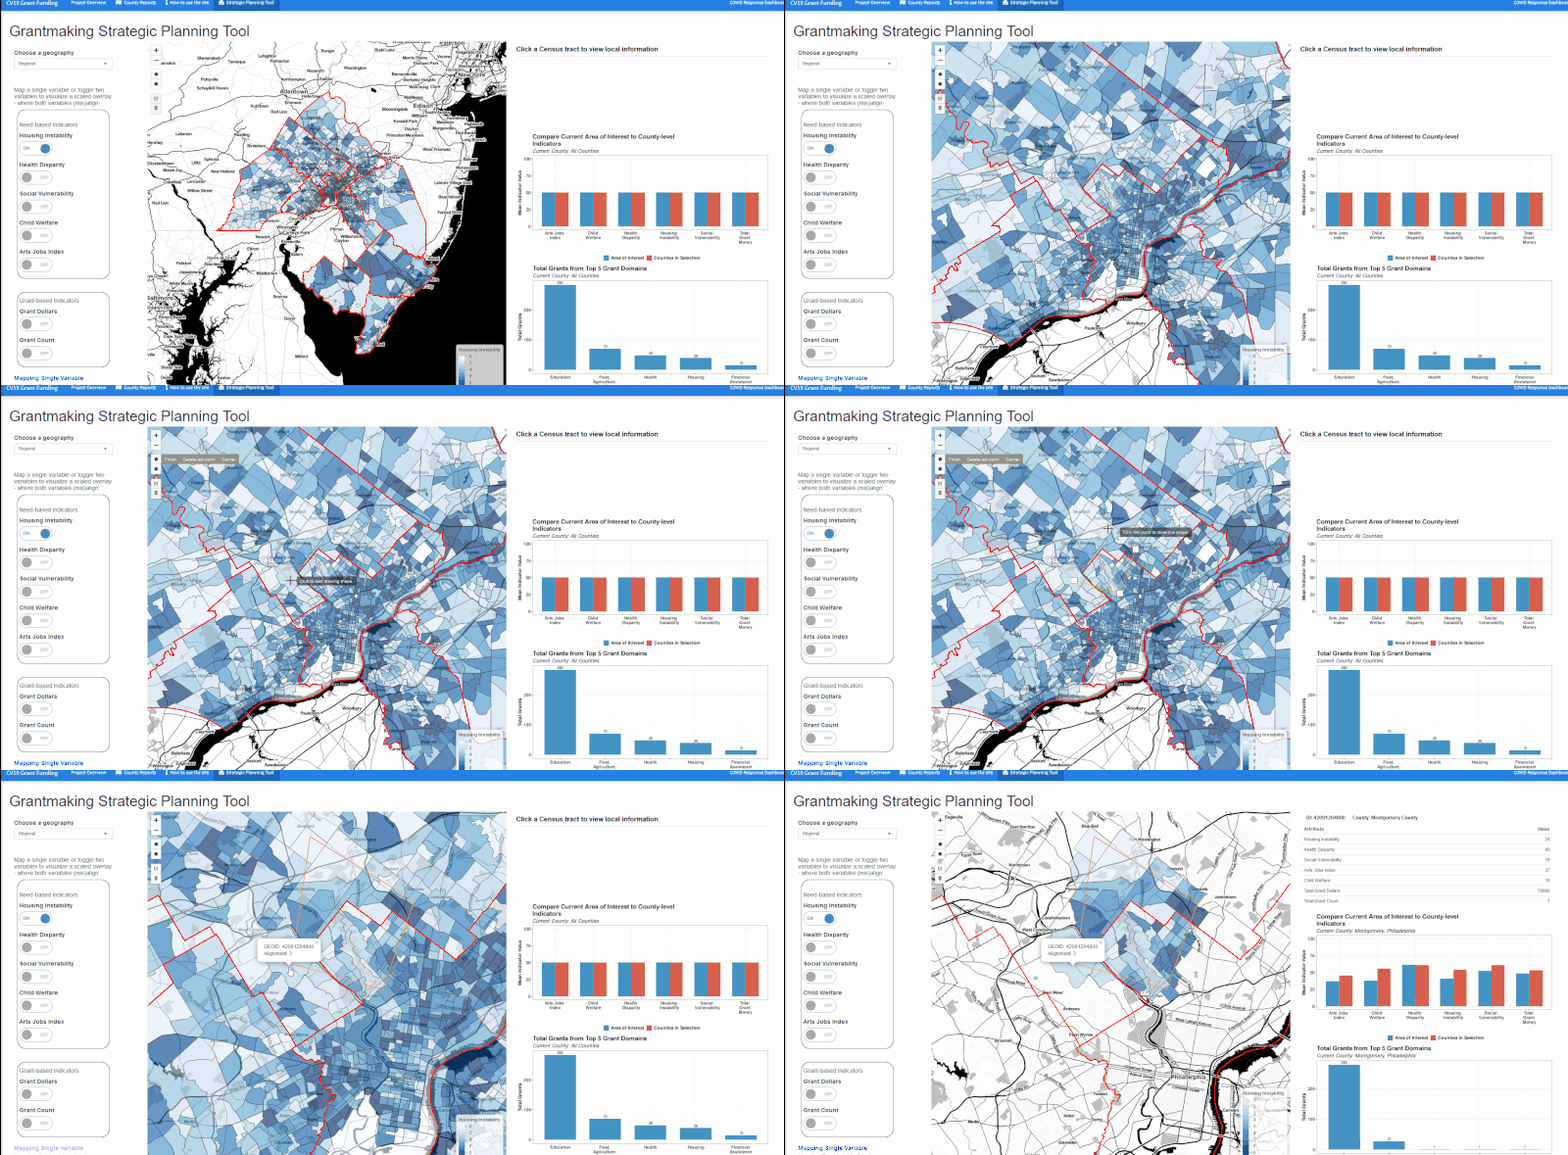
The final use case, an interactive Strategic Planning Tool, was designed to help the most advanced user, like a grant manager, understand granting and need for a specific Area of Interest (AOI). This is the functionality demonstrated in the animated gif above. Users can choose from and overlay relevant analytics, draw and zoom to their custom AOI, and begin to develop placed-based strategic plans at the neighborhood scale.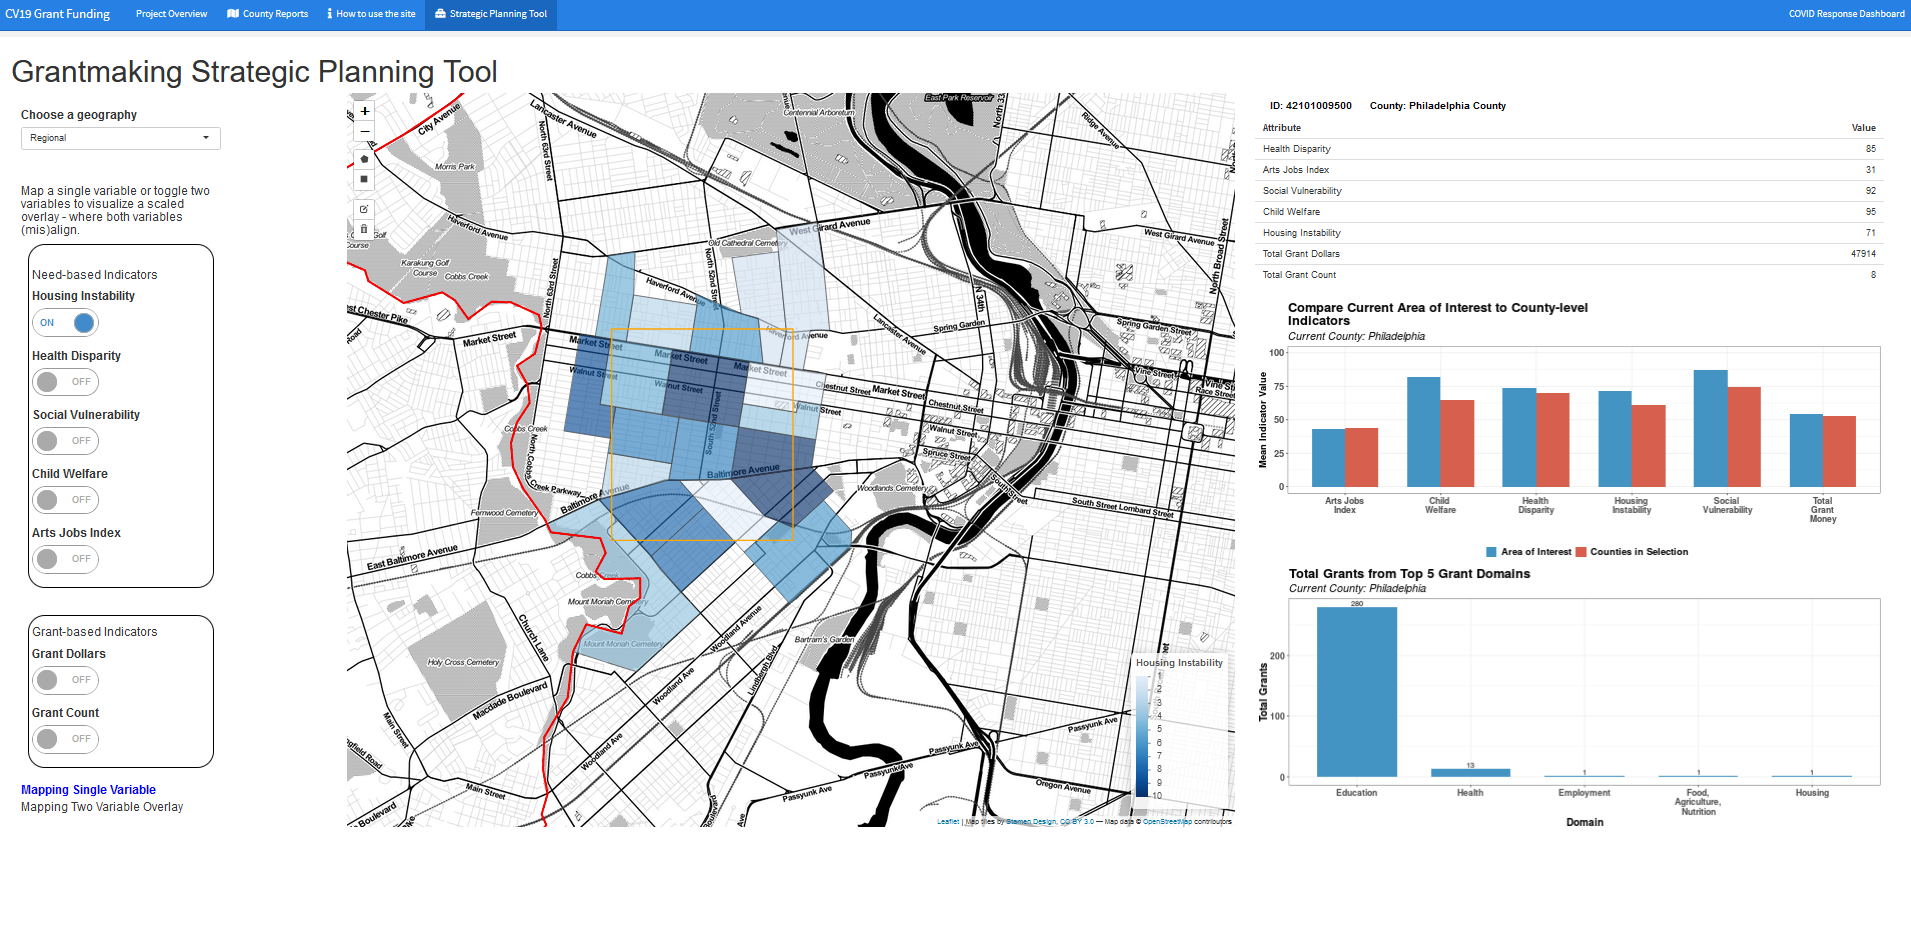 The success of this project was a function of the interdisciplinary team that built it. Should the philanthropic sector have interest in pursuing new strategic planning tools, some ideas on how to improve on this functionality include:
- Providing more social, economic, and health-related metrics that can help grant managers target place-based grants.
- Enabling more coordinated across-organization planning by analyzing grants made by multiple funders in a single community.
- Promoting place-based evaluation by comparing outcomes for supported communities to outcomes in comparable areas.
Finally, this is the first comprehensive information system we have built at Urban Spatial, turning the entire project around in a bit more than two months. Before the client decided on a static dataset, the scope called for a system with data that updated nightly. We chose R as a timely approach for scaling out these analytics across each use case.
Marrying analytics with Planning is our reason-to-be, which made this project incredibly enjoyable. We hope this is the first of many information systems we have a chance to create.
Ken Steif, Ph.D is the founder of Urban Spatial. You can follow him on Twitter @KenSteif. He is the Program Director of the Master of Urban Spatial Analytics program and a Professor of Practice in City Planning, both at the University of Pennsylvania.
