Below is a brief post on a larger study which can be found here.
Federal, state and local governments allocate billions of dollars every year to the provision of critical social services but lack the capacity to deliver these services themselves. Instead, they contract with Service Providers, mostly non-profits, to deliver services to the communities that need them most.
This process highlights an important example of the two types of decisions that governments make. The first is big budgetary decisions like for instance, $30 million for homelessness services. Once that budget is approved however, those dollars are transferred to an agency and some decision-making process allocates that $30 million in small chunks.
This is where data science in government really shines. What is the cost/benefit of those many micro-decisions? Are the residents most in need receiving services? Do they even know those services exist? To put it in a strategic planning context, is the current demand for social services currently met by the provision of those services? These questions are the focus of this project.
Seattle, Washington, like many jurisdictions across the country, funds non-profits to provide social services to residents and then collects back client-level data for each service provided. This kind of system is often referred to as a Service Delivery Systems. Seattle recently took the unprecedented step of releasing 7 years of their Aging and Disability service data as open data, making sure to redact/aggregate the data to protect the privacy of those described therein.
To our knowledge, no open dataset like this exists anywhere in the U.S., and we were thrilled to have the opportunity to develop some strategic planning metrics with the data along with a vision for a new kind of Service Delivery System. You can read the brief report in full here or keep reading for some quick insights.
We employ a 3 stage process for finding value in these Aging and Disability service data that could be replicated for any client/service dataset in any jurisdiction throughout the country. Indicators mine the data for relevant insight; Forecasts help agencies understand localized demand for services; and Dashboards help ensure that services are of high quality and that service demand is aligned with service provision.
As usual, much of our code is open sourced and appears in an appendix in the full report.
Indicators
Often service delivery data sits in legacy databases and is thus not used for regular planning and evaluation. Making these data more accessible as Seattle has done, allows for the creation of simple indicators describing client and service history. Below is a handful of examples from the report.
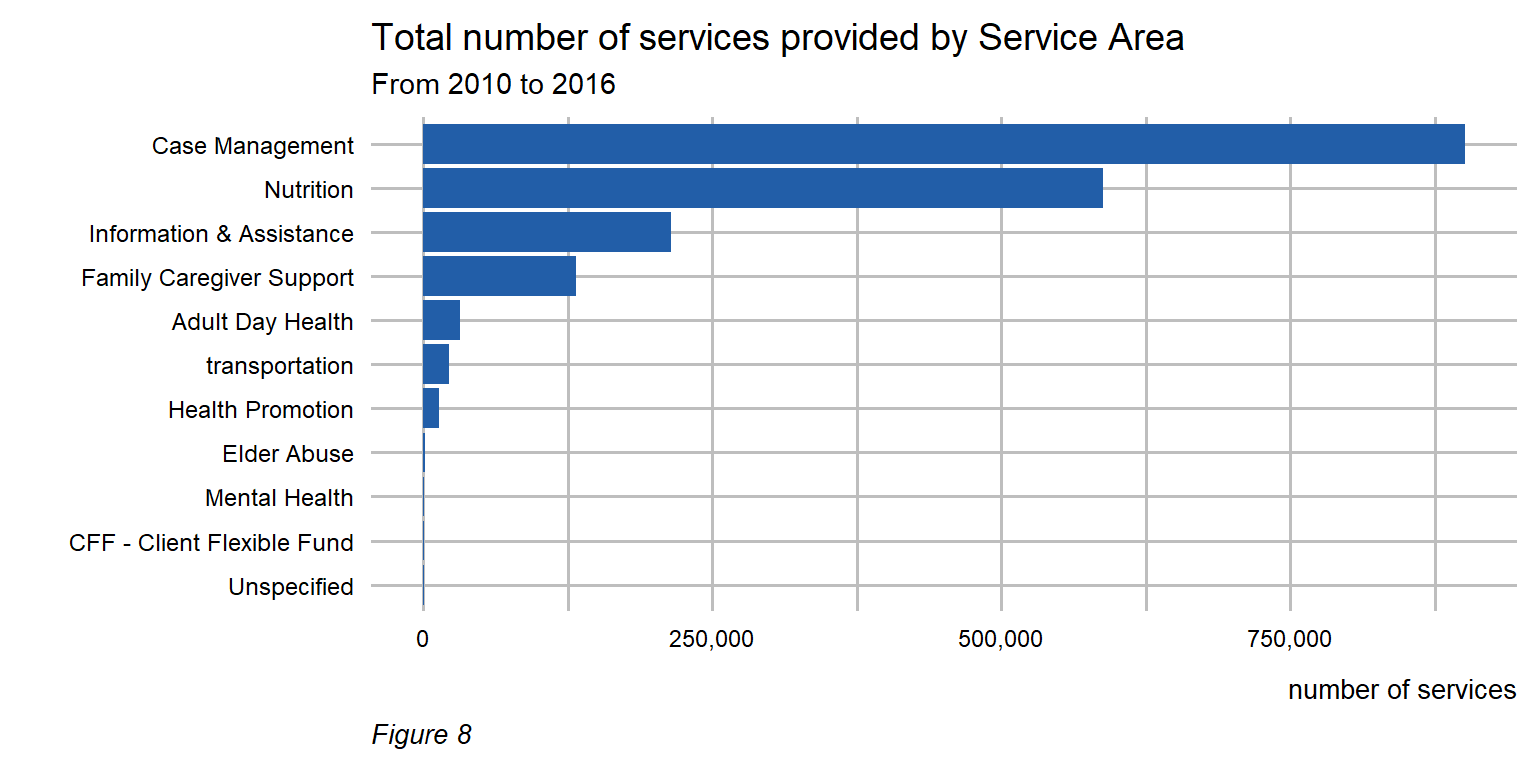
Below is the total number of services by service type. The plot illustrates just how many services Seattle provides its residents. One can imagine the total public expenditure for these critical services.
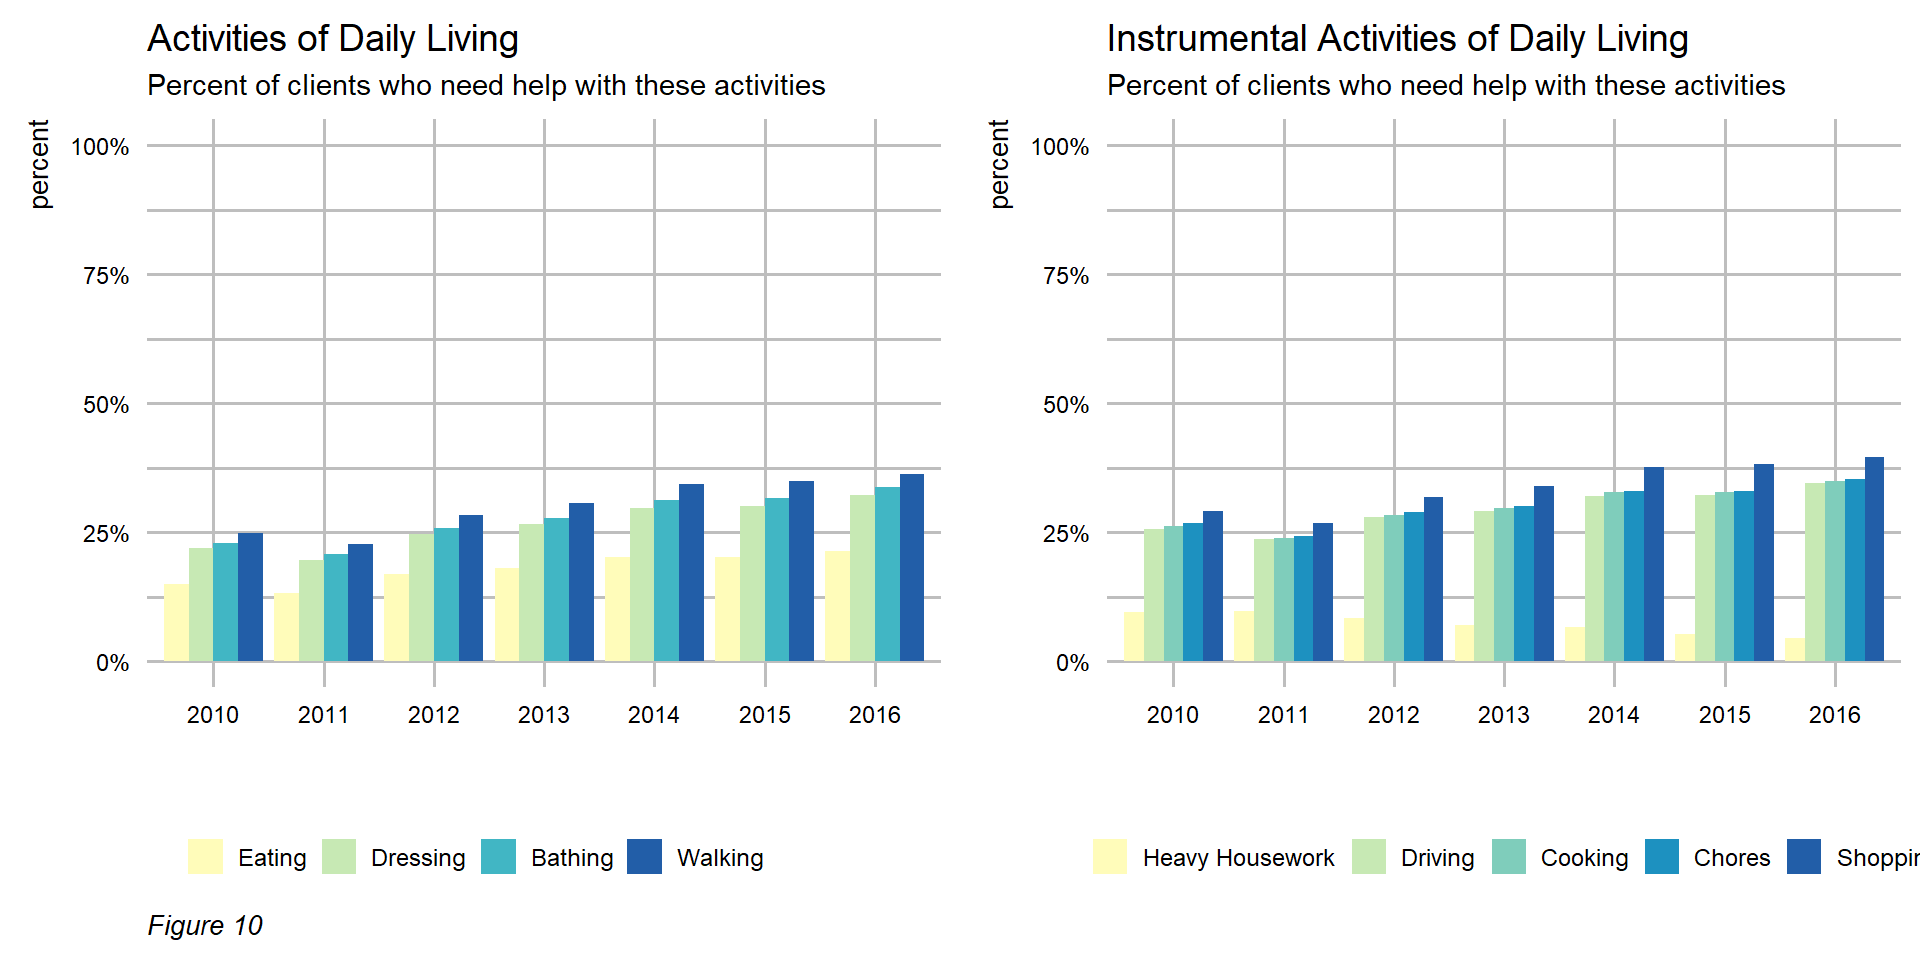
These data also provide valuable insight into the characteristics of clients who receive these services. The below plots suggest that the population described in these data are becoming less self-sufficient with each passing year.
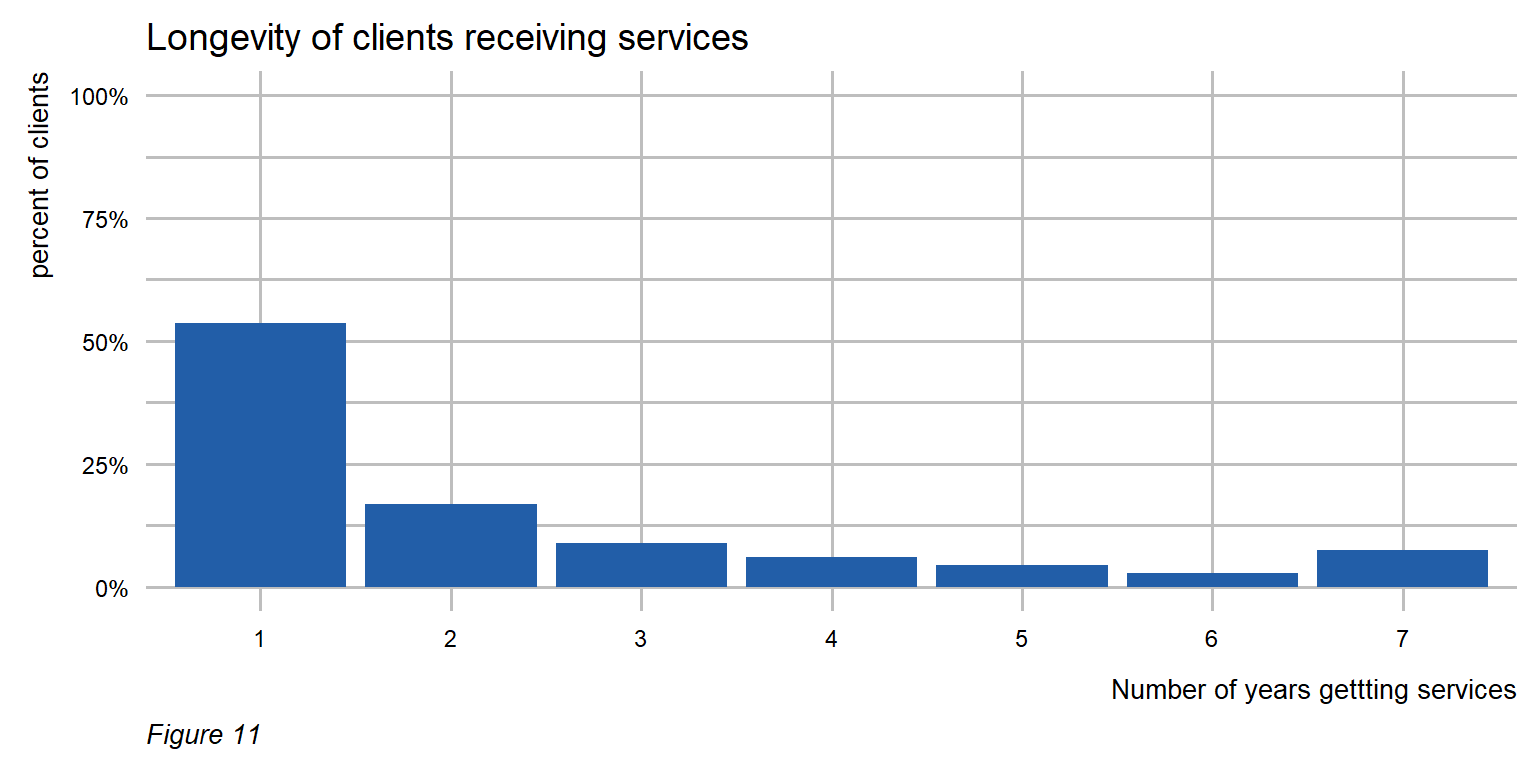
Speaking of the longitudinal nature of these data, there are tremendous benefits for understanding how Service Providers engage individual clients over time. Here we can see that most of those who receive services, do so for only one year. It is rare for a client to receive services for 3 consecutive years or more.
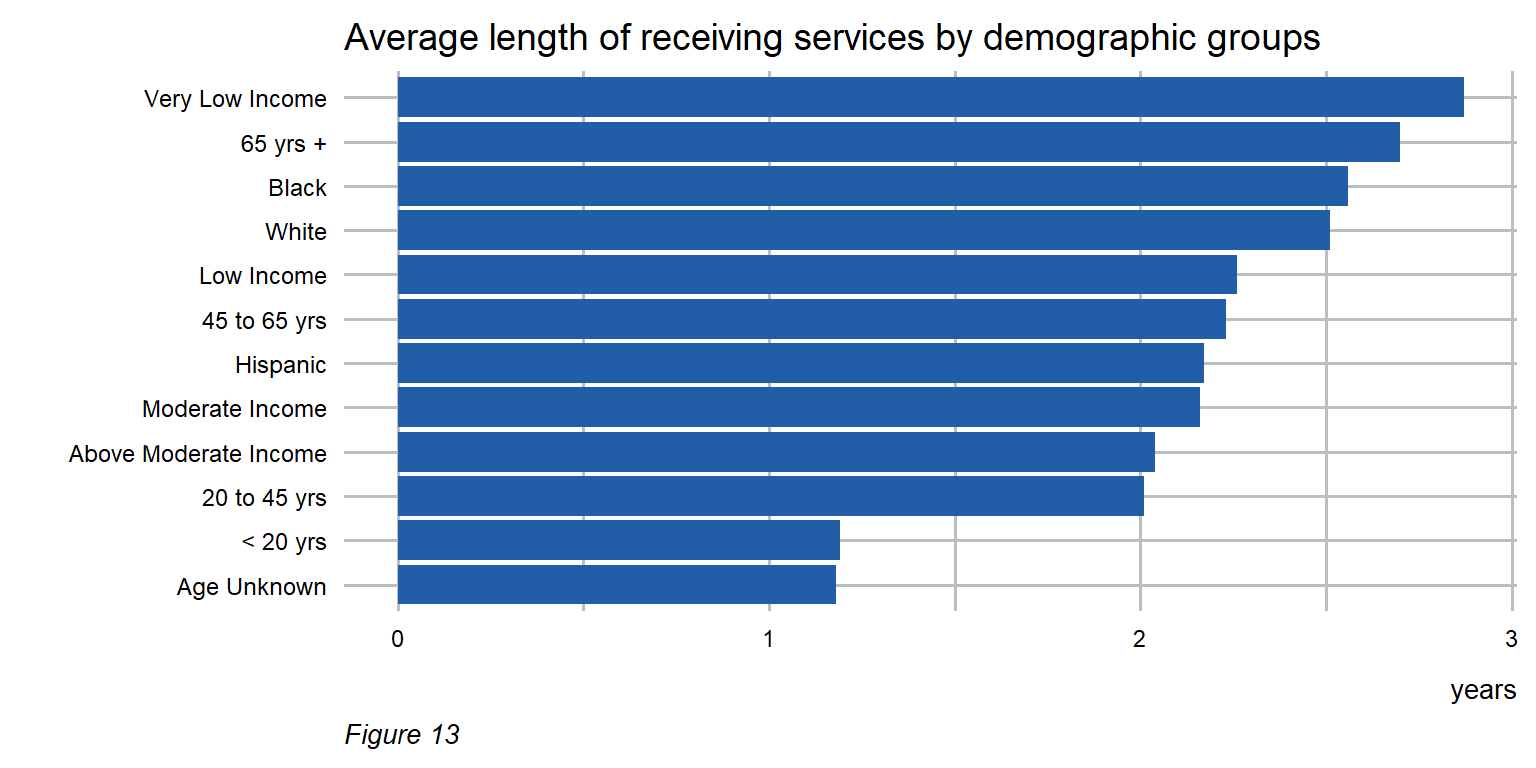
Below, we can see on average, those populations who receive services for the longest period of time.
Finally, these data provide important insight into other policy concerns that may be indirectly related to elderly and disabled individuals. Seattle is a city that has undergone a tremendous amount of housing market growth, making it increasingly difficult to find affordable housing. The service data reflect this trend. 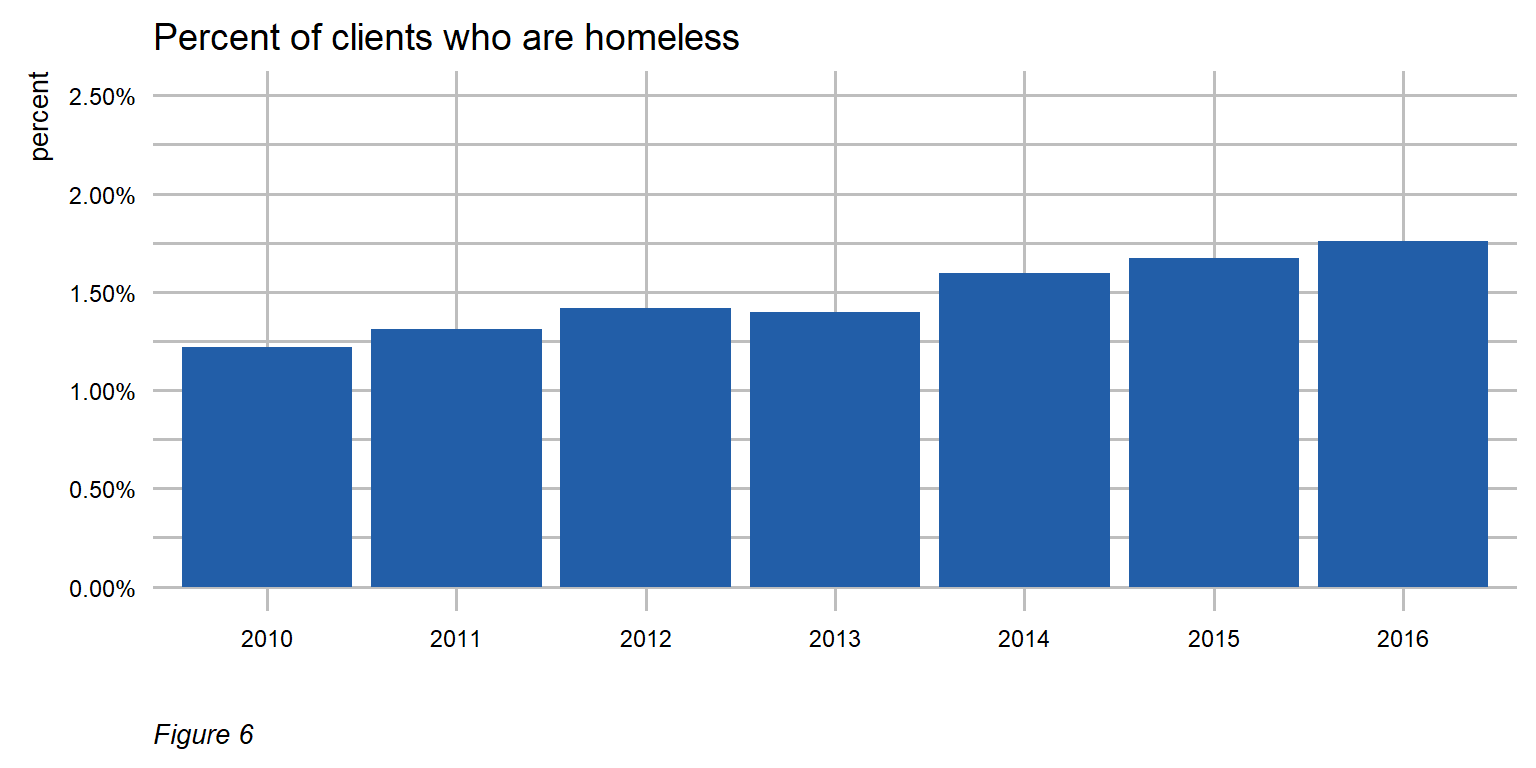
Forecasting Demand
There are many use cases in healthcare analytics that require one to predict who will require what service when. This is often done to understand risk and ensure efficient service provision. Governments can borrow these strategies from the healthcare industry in order to minimize the social costs associated with inefficient service delivery.
We train machine learning models on 6 years of service history, demographic, and other data to predict the count of services for each client in the seventh year. If demand for a given service can be predicted, governments and Service Providers may be able to do a better job planning and budgeting to meet short term demand.
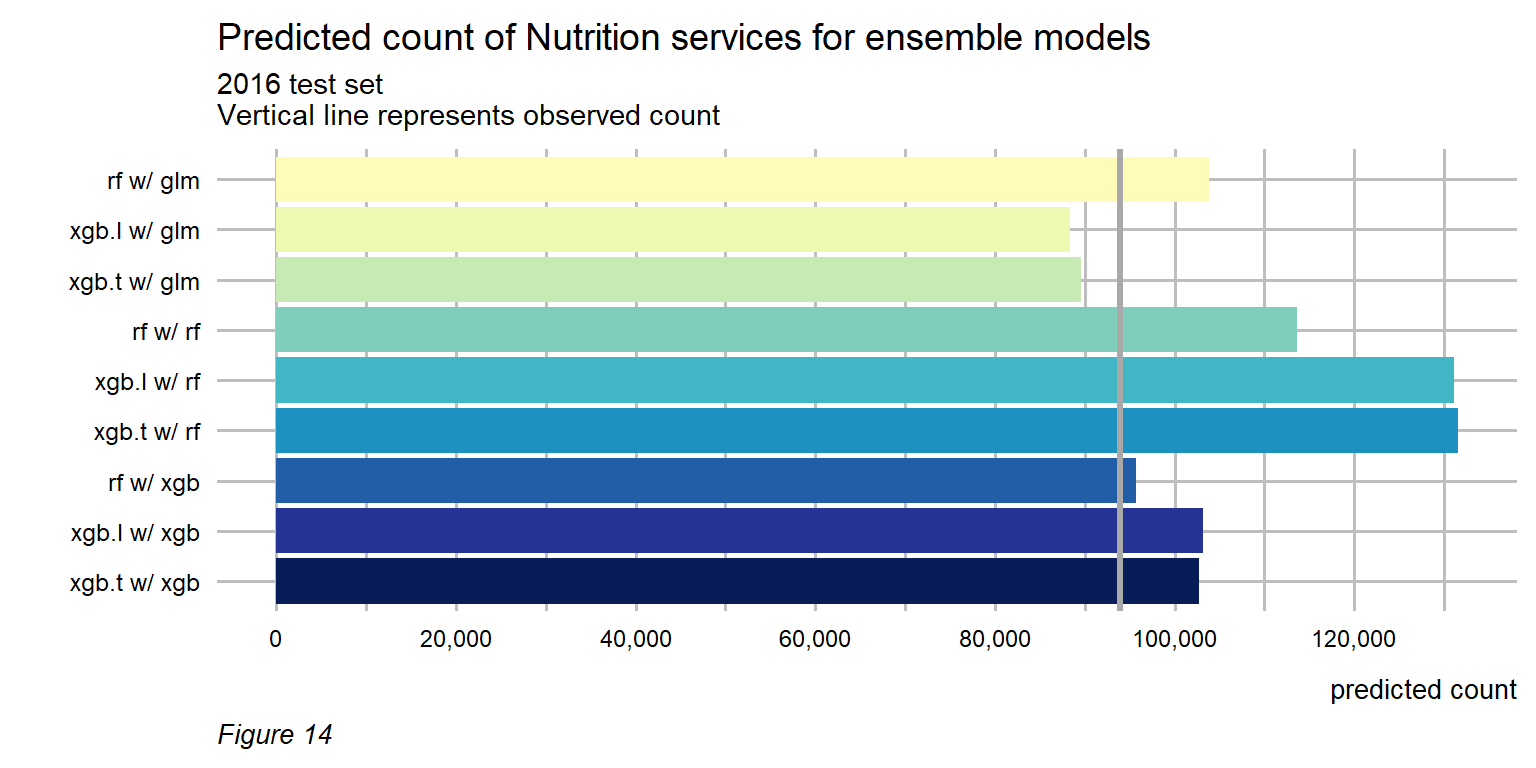
We develop some fairly sophisticated ensemble models, and as the plot above shows, our best models predict the count of service provision within less than 2% of the observed count. The report discusses these models in greater depth and includes a host of metrics we developed to ensure algorithmic fairness. Fairness has become an important component of all the algorithms we build at Urban Spatial.
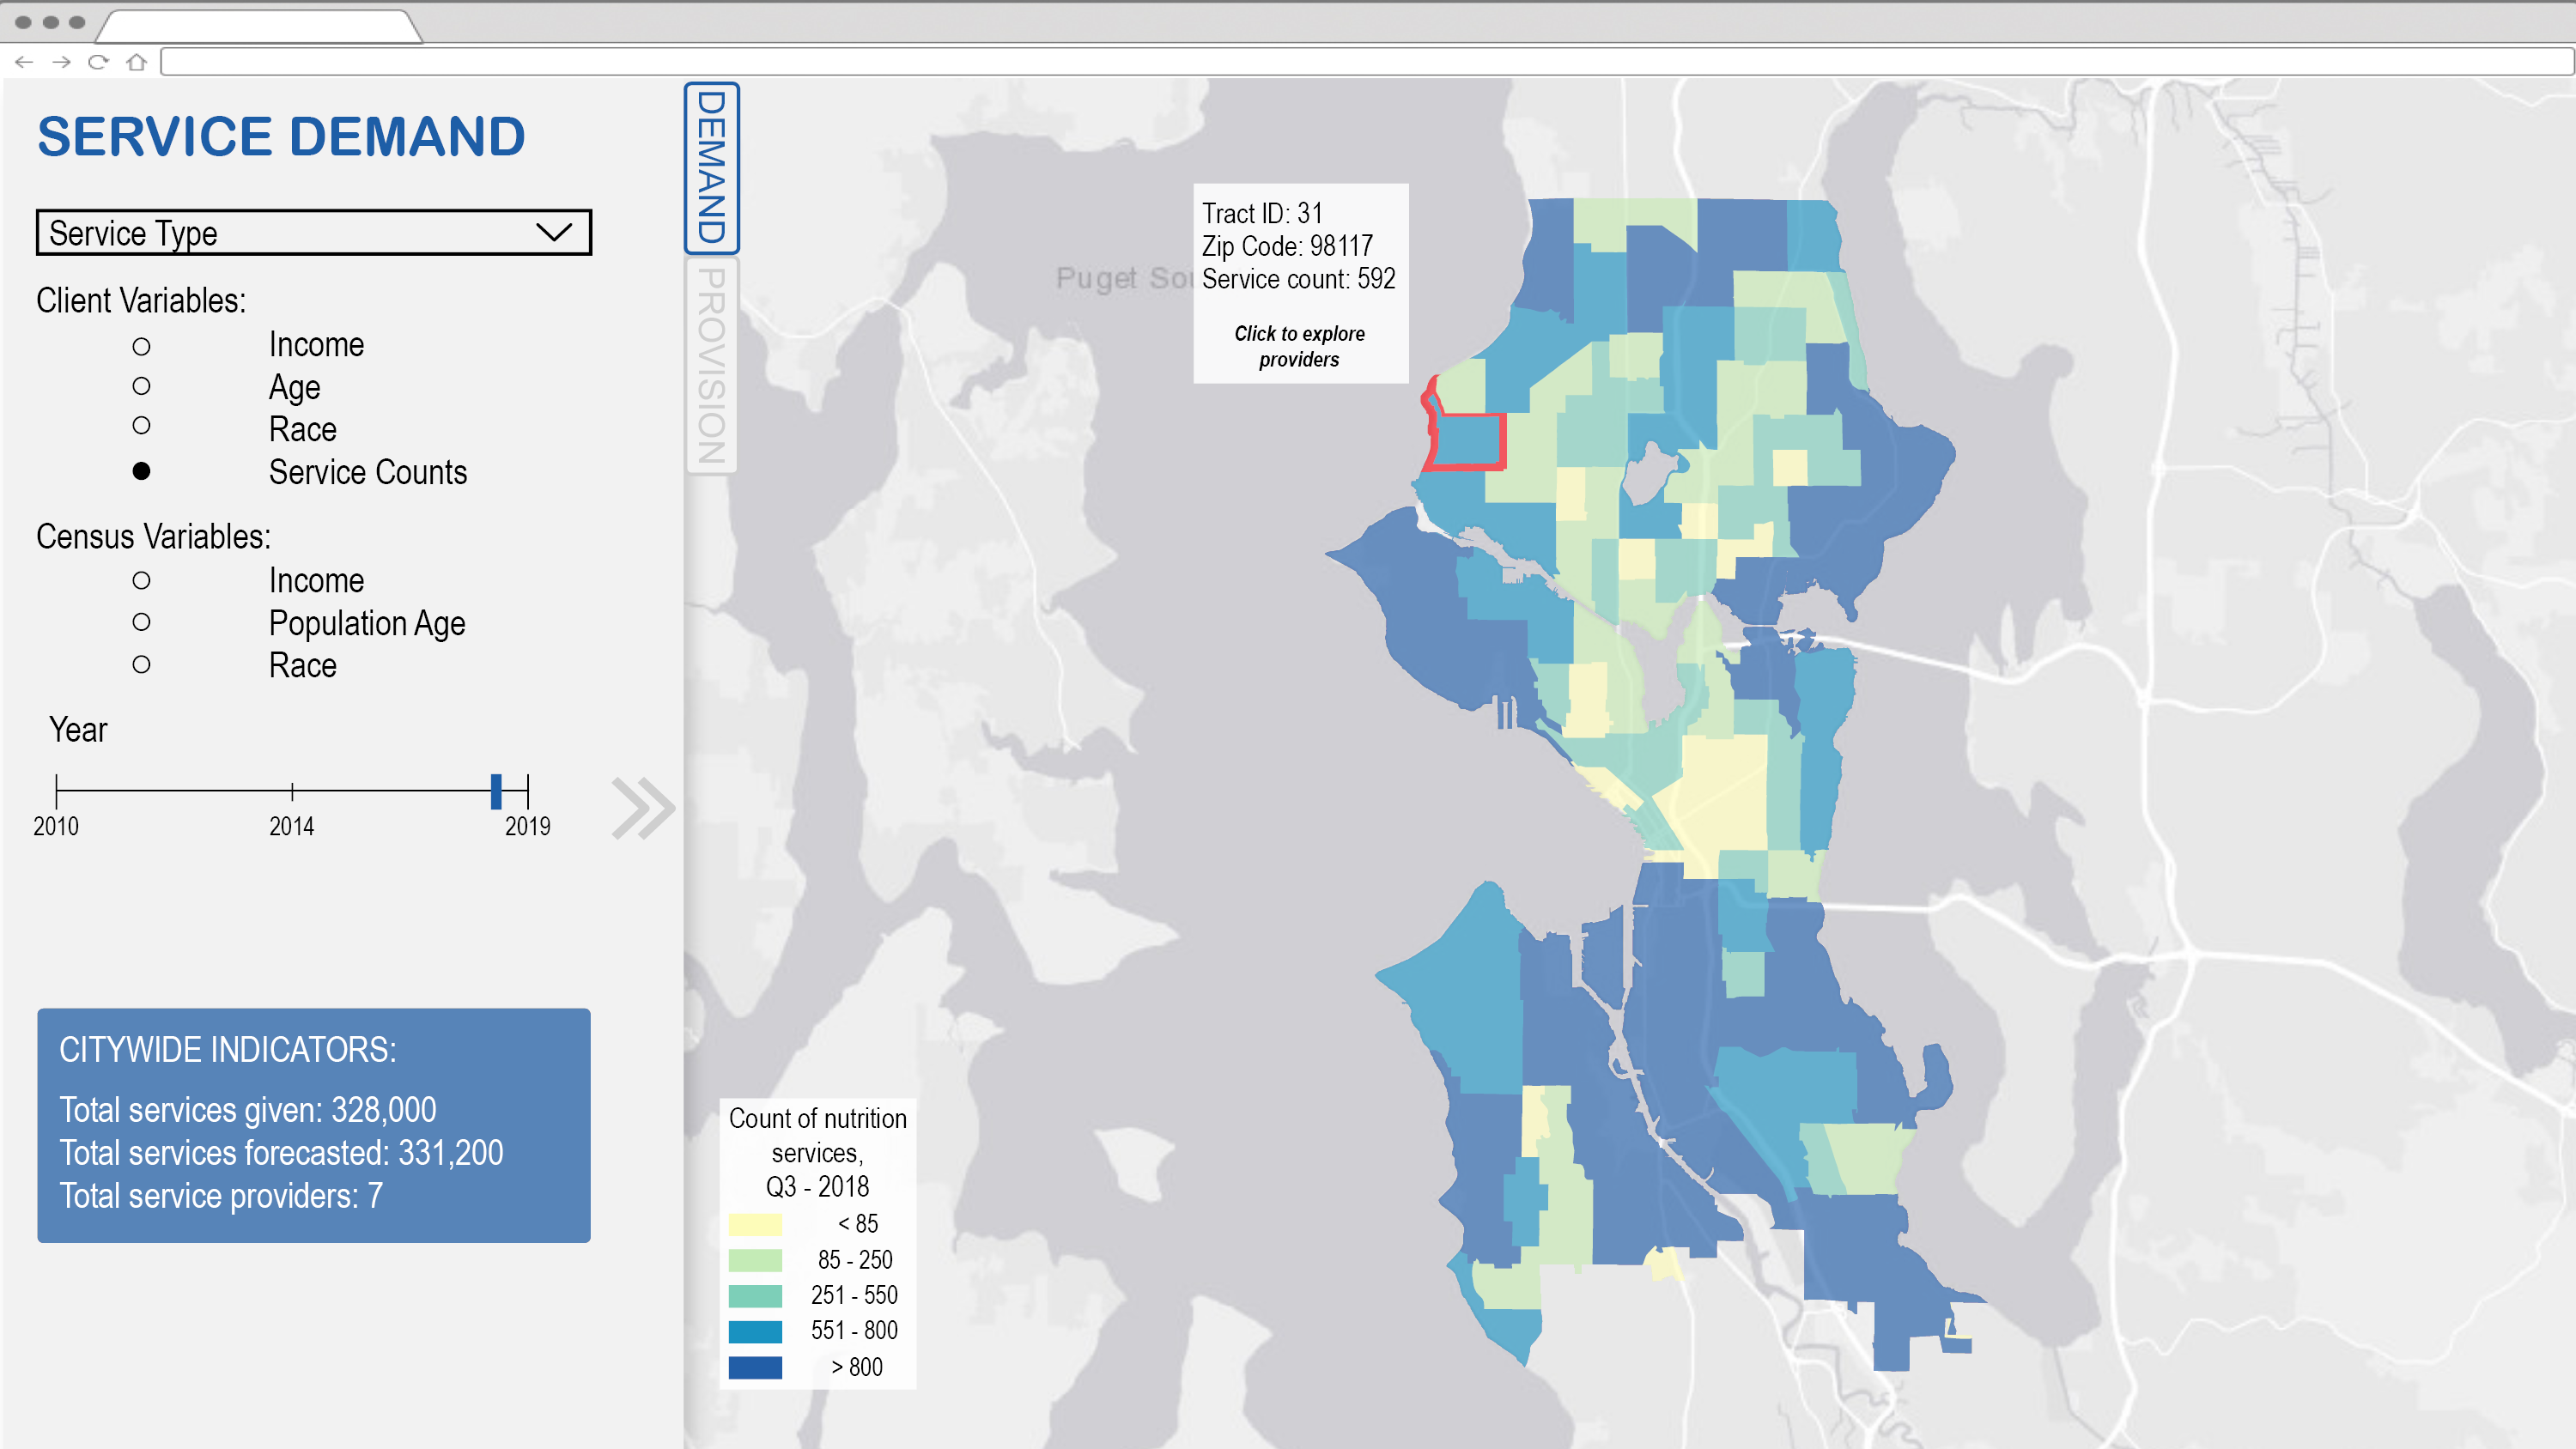
Dashboarding & Actionable Intelligence
We identify four critical use cases that any Service Delivery System should have:
- Where is the actual and forecasted demand for services across space?
- Where does the provision of services currently meet that demand?
- How are Service Providers collaborating or competing in shared Service Areas?
- What can Service Provider audits tell us about the efficacy of these programs?
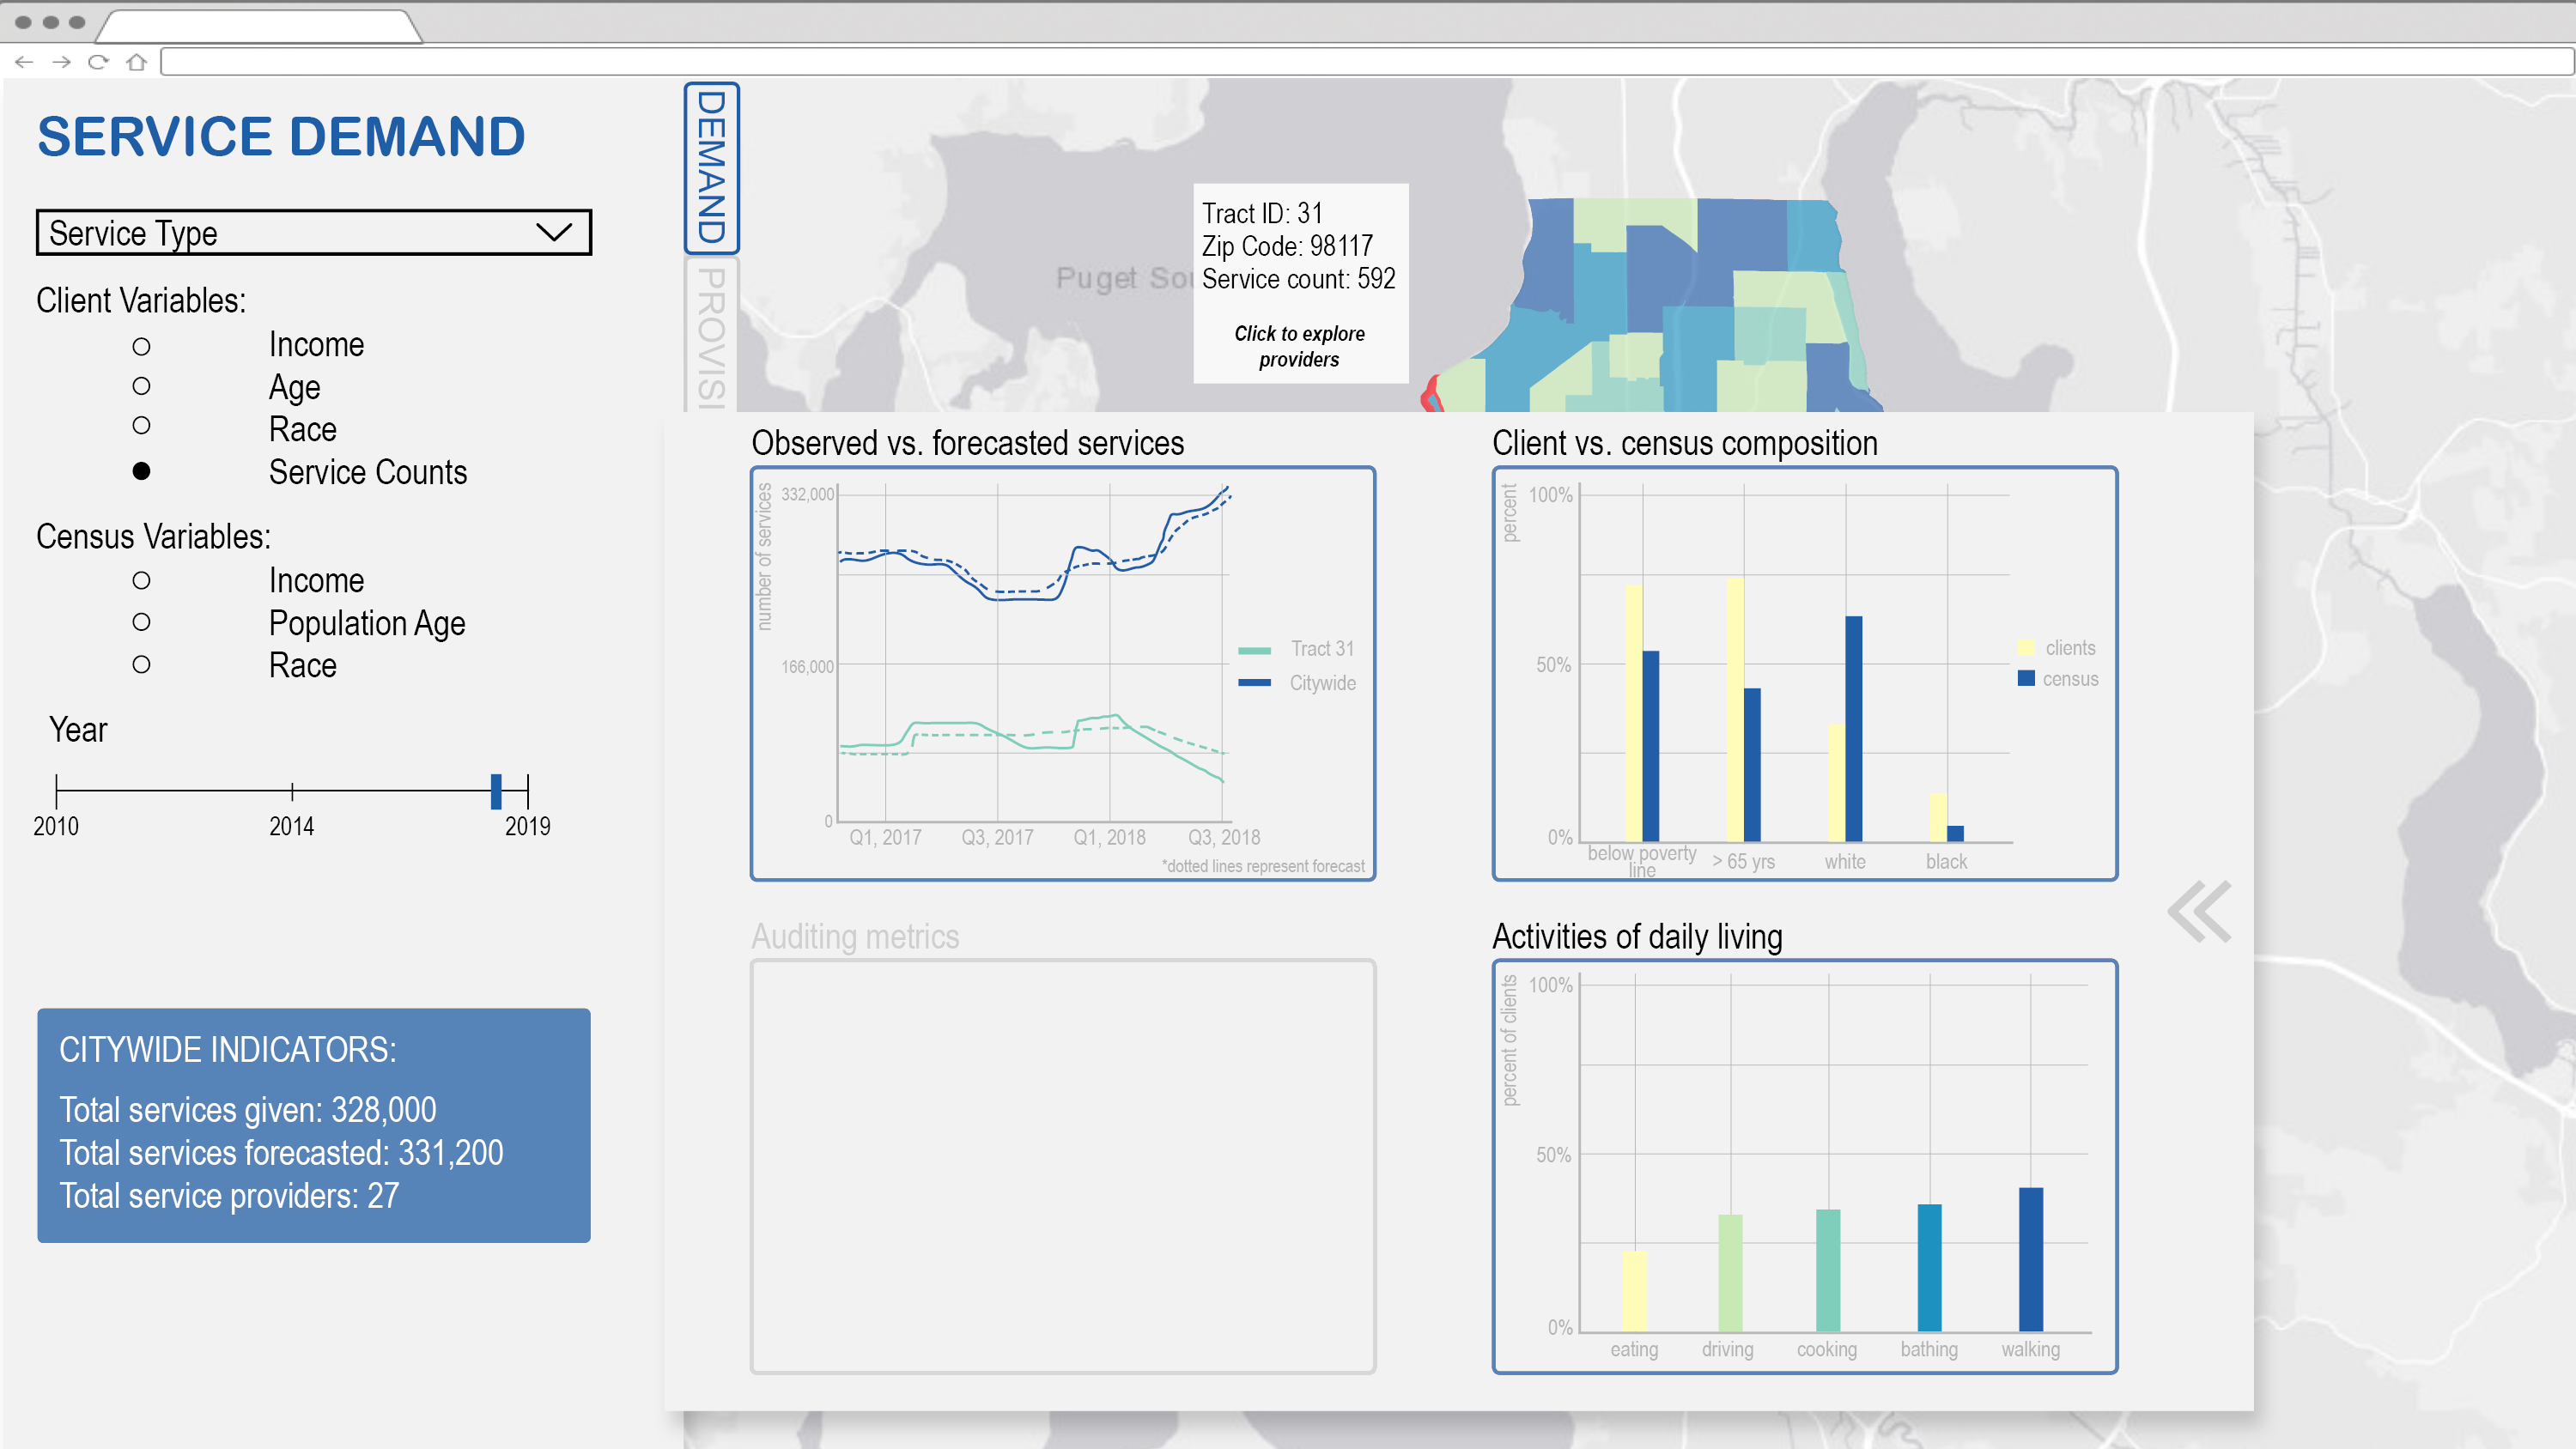
The dashboards we wireframed, like the one below, help governments and Service Providers ensure that services are deployed where and to whom they are needed the most. Check out the report to learn more about how this dashboard addresses the aforementioned use cases.
Governments at all levels allocate huge sums of money to service providers who go into communities and work toward the health and wellbeing of our most vulnerable citizens. There is tremendous value in the data collected and reported by these Service Providers, that if unlocked, could help ensure these investments having lasting impacts.
Ken Steif, PhD is the founder of Urban Spatial. You can follow him on Twitter @KenSteif. He is the Program Director of the Master of Urban Spatial Analytics program at the University of Pennsylvania. Sydney Goldstein is the Predict Align Prevent Data Science Fellow at Urban Spatial.